


Furukawa Electric (TSE:5801) Climbed, So What Is Driving Attention Now?
Fresh research on shape memory materials points to strong demand across healthcare, aerospace, robotics, and automotive uses, putting Furukawa Electric (TSE:5801) directly in focus as a highlighted participant in this maturing niche.
Furukawa Electric has seen sharp swings, with the share price up 2.5% on the day to ¥3,812 even as the 7 day and 30 day share price returns declined 7.7% and 11.3% respectively. In contrast, the year to date share price return of 261.7% and the very large 5 year total shareholder return suggest strong longer term momentum that recent shape memory materials interest may be helping to refresh in investors’ minds.
Scan 38 robotics and automation stocks that, like Furukawa Electric, are tied into real-world demand for shape memory materials across healthcare, aerospace, robotics, and next-generation automotive applications.
Bulls point to Furukawa Electric’s strong multi year shareholder returns and shape memory exposure, while bears flag the recent pullback and past volatility. Which side do the current valuation markers support next?
Preferred P/E of 29.9x for Furukawa Electric: Is it justified?
On valuation, the market is currently paying a P/E of 29.9x for Furukawa Electric at a share price of ¥3,812. That price tag sits above several comparison points even though the stock is flagged as trading at a 19.1% discount to an estimated fair value based on projected cash flows.
The P/E multiple captures how much investors are willing to pay today for each unit of Furukawa Electric's earnings. This matters for a group exposed to infrastructure and electronics cycles where profits can swing meaningfully from year to year.
Strong recent metrics sit on one side of the scale. Earnings grew 164.7% over the past year, the 5 year earnings growth rate sits at 45.8% per year, and net profit margins are recorded at 6.5% compared with 2.8% a year earlier. Forecasts also point to earnings growth of 19.6% per year and revenue growth of 10.4% per year, both higher than the 8.8% and 6.4% figures cited for the wider JP market. A Return on Equity of 20.5%, with projections of 23.4% in three years, reinforces the idea that current profitability sits at the higher end of the spectrum.
The other side of the ledger is about context. Large one off items are reported as affecting earnings quality, including a ¥29.3b gain in the last 12 months to 30 June 2026, and the share price has been highly volatile over the past three months. Against that backdrop, a P/E of 29.9x is described as expensive relative to both the JP Electrical industry average of 13.3x and a peer group average of 24.8x. This is the case even though internal modelling points to a fair P/E closer to 39.8x as a level the market could move toward if current expectations are maintained.
Explore the SWS fair ratio for Furukawa Electric.
Result: Price-to-earnings of 29.9x (OVERVALUED).
Still, a sharp 17.8% share price decline over 90 days and earnings flattered by one off gains could quickly challenge the bullish Furukawa Electric narrative.
Find out about the key risks to this Furukawa Electric narrative.
Another view on Furukawa Electric’s value
While the P/E of 29.9x makes Furukawa Electric look expensive against the JP Electrical industry on 13.3x and peers on 24.8x, the SWS DCF model paints a different picture. From that perspective, the shares at ¥3,812 sit below an estimated future cash flow value of ¥4,714.36. Which lens matters more for you?
Look into how the SWS DCF model arrives at its fair value.
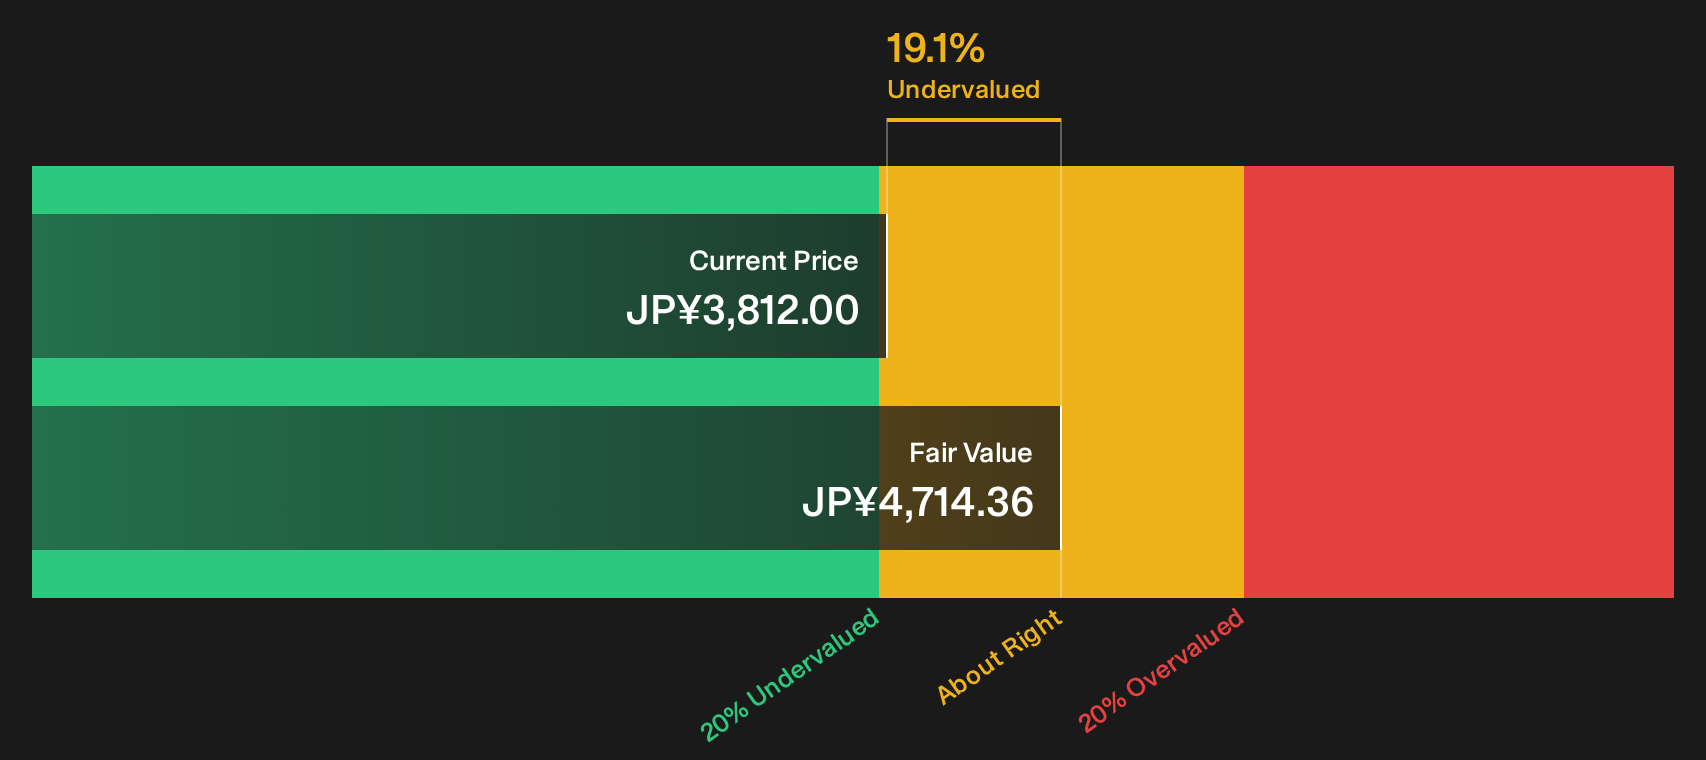
Simply Wall St performs a discounted cash flow (DCF) on every stock in the world every day (check out Furukawa Electric for example). We show the entire calculation in full. You can track the result in your watchlist or portfolio and be alerted when this changes, or use our stock screener to discover 18 high quality undervalued stocks. If you save a screener we even alert you when new companies match - so you never miss a potential opportunity.
Next Steps
Mixed signals around Furukawa Electric’s valuation and earnings quality can feel confusing. Move quickly, review the full dataset, then weigh the 3 key rewards and 3 important warning signs.
Looking for more investment ideas beyond Furukawa Electric?
Do not stop at Furukawa Electric. Broaden your watchlist with a few focused stock ideas that match how you like to balance risk, income, and growth potential.
- Target potential mispricing by scanning companies flagged as 18 high quality undervalued stocks that pair stronger fundamentals with a valuation that has not fully caught up yet.
- Prioritise resilience by filtering for 12 resilient stocks with low risk scores that aim to keep balance sheets and risk scores front and center in your process.
- Hunt for future leaders early by reviewing 74 high quality undiscovered gems that combine quality metrics with relatively low market attention.
This article by Simply Wall St is general in nature. We provide commentary based on historical data and analyst forecasts only using an unbiased methodology and our articles are not intended to be financial advice. It does not constitute a recommendation to buy or sell any stock, and does not take account of your objectives, or your financial situation. We aim to bring you long-term focused analysis driven by fundamental data. Note that our analysis may not factor in the latest price-sensitive company announcements or qualitative material. Simply Wall St has no position in any stocks mentioned.
Have feedback on this article? Concerned about the content? Get in touch with us directly. Alternatively, email editorial-team@simplywallst.com