


X Energy (XE) Enters UK Reactor Review, Is The Valuation Already Too Rich?
UK reactor review puts X-Energy in focus
X-Energy (NasdaqGS:XE) moved into the spotlight after its Xe-100 small modular reactor design was accepted into the United Kingdom's Generic Design Assessment, through its alliance with Centrica.
The review, expected to run for about three years under UK nuclear and environmental regulators, is a key gate for plans to deploy up to 6 GW of Xe-100 capacity across 10 to 20 potential power stations.
The Xe-100 news comes after a difficult period for X-Energy’s stock. The share price is down 21.54% over the past week and 48.54% year to date, and the most recent 1-day share price return of 3.93% lower suggests ongoing pressure rather than building momentum.
Scan beyond X-Energy and compare it with other nuclear-focused businesses by reviewing the hand-picked 91 nuclear energy infrastructure stocks that are now shaping the next phase of power infrastructure.
X-Energy now trades well below both its recent levels and the analyst target range. The real puzzle is where fair value sits in that gap.
Price-to-Sales of 28.7x: Is it justified?
X-Energy closed at $15.03 while trading on a P/S ratio of 28.7x, a level that points to a rich valuation compared with many listed peers.
The P/S multiple compares the market value of the equity with its annual revenue. For a business like X-Energy, which designs nuclear reactor technology and currently reports a loss of $448.9 million on revenue of $150.3 million, investors are effectively paying a high price for each dollar of sales while accepting that profits are not yet in sight.
That valuation sits against several facts. XE is forecast to remain unprofitable over the next 3 years and is not expected to achieve profitability over that period. It also has a negative return on equity of 26.83% and 100% of its liabilities come from higher risk funding sources, rather than lower risk customer deposits.
The premium becomes clearer when you compare it with benchmarks. XE is described as expensive on its 28.7x P/S ratio versus the US Electrical industry average of 2x. It is also flagged as expensive versus a peer group average P/S of 4.8x, which indicates the market is paying a very high multiple of sales for X-Energy relative to both its sector and closer comparables.
See what the numbers say about this price — find out in our valuation breakdown.
Result: Price-to-Sales of 28.7x (OVERVALUED)
Still, X-Energy carries real pressure points, including the continuing loss of $448.9 million and a market value near $6.4 billion, which leaves little margin for disappointment.
Find out about the key risks to this X-Energy narrative.
Another view on X-Energy's value
There is a different lens you can use on X-Energy. The SWS DCF model estimates the value of future cash flows at $11.86 per share, compared with the recent $15.03 price, which points to the stock trading above that fair value estimate. Which signal do you treat as the anchor?
Look into how the SWS DCF model arrives at its fair value.
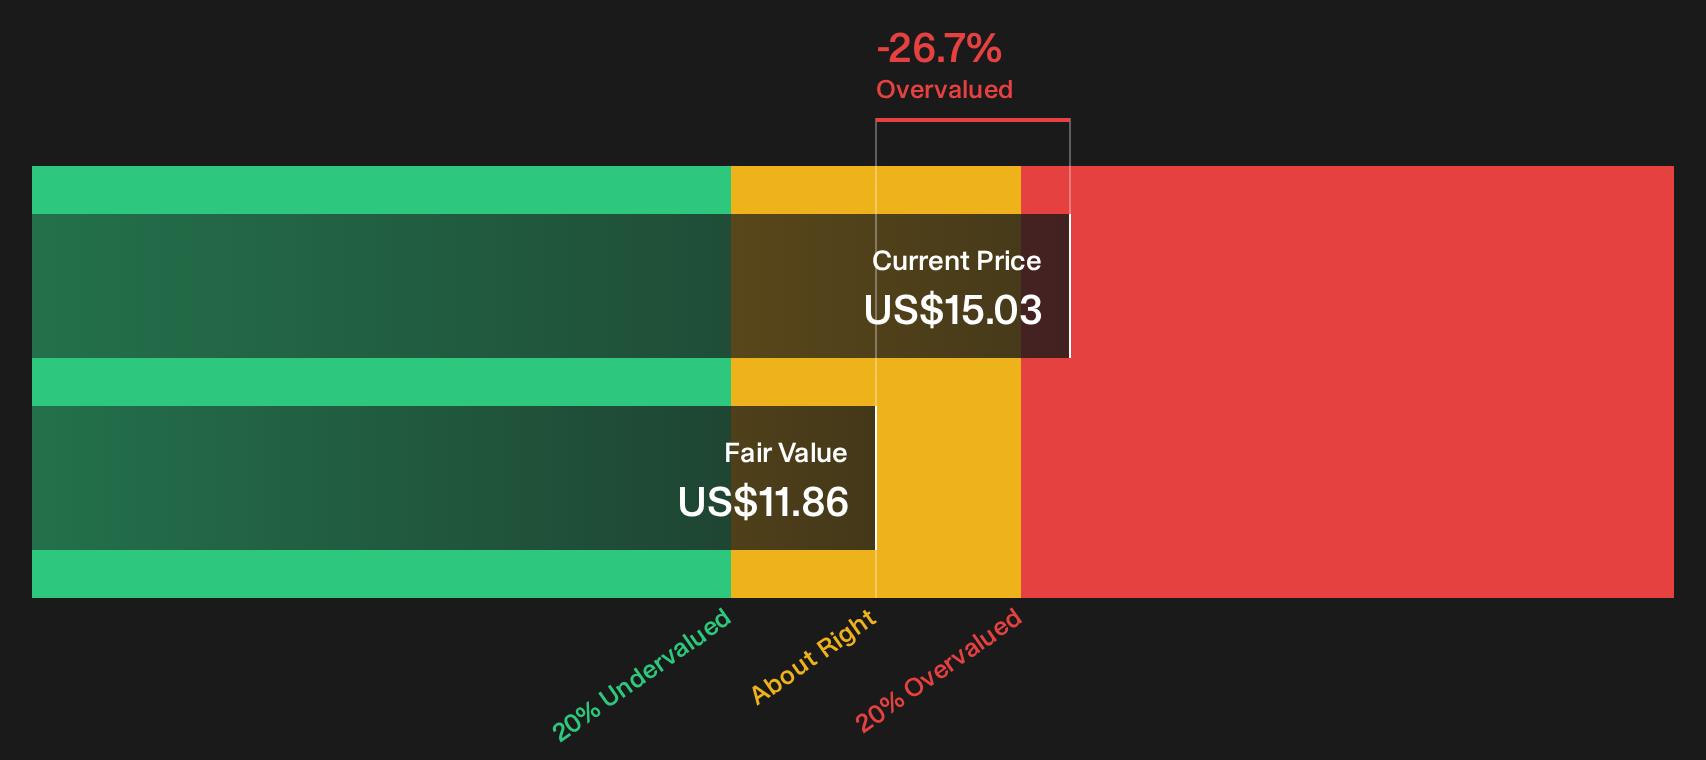
Simply Wall St performs a discounted cash flow (DCF) on every stock in the world every day (check out X-Energy for example). We show the entire calculation in full. You can track the result in your watchlist or portfolio and be alerted when this changes, or use our stock screener to discover 34 high quality undervalued stocks. If you save a screener we even alert you when new companies match - so you never miss a potential opportunity.
Next Steps
Mixed signals surround this X-Energy story, so do not sit on the sidelines while others interpret them for you. Review the numbers, weigh the pressure points against the upside, then use the 2 key rewards and 2 important warning signs.
Looking for more X-Energy investment ideas?
Do not stop with X-Energy. Broaden your watchlist with fresh angles, compare quality, and pressure test your thesis against other potential opportunities across the market.
- Spot potential turnaround opportunities early by scanning the 2 elite penny stocks with strong financials that pair low share prices with relatively stronger fundamentals than many peers.
- Focus on value with quality by reviewing the 34 high quality undervalued stocks that combine solid balance sheets with pricing that screens as below estimated worth.
- Prioritise resilience and capital protection by filtering for the 11 resilient stocks with low risk scores that carry lower risk scores and may offer a steadier ride through volatility.
This article by Simply Wall St is general in nature. We provide commentary based on historical data and analyst forecasts only using an unbiased methodology and our articles are not intended to be financial advice. It does not constitute a recommendation to buy or sell any stock, and does not take account of your objectives, or your financial situation. We aim to bring you long-term focused analysis driven by fundamental data. Note that our analysis may not factor in the latest price-sensitive company announcements or qualitative material. Simply Wall St has no position in any stocks mentioned.
Have feedback on this article? Concerned about the content? Get in touch with us directly. Alternatively, email editorial-team@simplywallst.com