


Mitsubishi Logistics (TSE:9301) Looks Fully Priced Following Its 26% Year To Date Gain
Mitsubishi Logistics (TSE:9301) drew fresh attention after its latest trading session, with the share price closing at ¥1,543.5 and shorter term returns contrasting with the company’s mixed recent revenue and net income trends.
Recent trading has extended a steady upswing for Mitsubishi Logistics, with a 30-day share price return of 3.00% contributing to a 26.41% year-to-date share price gain. Long-term total shareholder returns above 100% over three and five years indicate momentum that has been building rather than fading.
Scan how Mitsubishi Logistics compares with other transport and infrastructure players by reviewing our hand picked list of list of solid balance sheet and fundamentals (20 results)
Mitsubishi Logistics now trades a little below analyst targets despite recent share price strength, so is the market rightly cautious about its softer net income trend, or is it underrating the logistics and real estate mix?
Preferred P/E of 12.4x for Mitsubishi Logistics: Is it justified?
Mitsubishi Logistics trades on a P/E of 12.4x, a level that sits slightly below both the broader Japan market and the Asian infrastructure peer group. This signals that investors are not paying a premium multiple for its earnings at the current ¥1,543.5 share price.
The P/E ratio compares the stock price with earnings per share. It effectively shows how many years of current profit investors are willing to pay for today. For a logistics and real estate group like Mitsubishi Logistics, this is a common yardstick because earnings are a key driver of returns in asset heavy businesses where revenue growth, at a forecast 3.6% a year, is relatively modest.
Recent earnings growth of 12.3% over the past year and a 5 year earnings growth rate of 16.7% per year suggest the business has delivered profit expansion, although those results are influenced by large one off items that reduce the clarity of the underlying trend. Against that backdrop, a 12.4x multiple that is above the SWS fair P/E estimate of 10.6x implies the market is pricing Mitsubishi Logistics meaningfully richer than the level indicated by regression based modelling if sentiment cools.
The comparison is even clearer against peers. Mitsubishi Logistics trades on 12.4x earnings, while both the Asian infrastructure industry and its direct peer group sit around 13x. This points to only a slight discount versus competitors but a marked premium against the 10.6x fair ratio estimate for the stock.
Explore the SWS fair ratio for Mitsubishi Logistics.
Result: Price-to-Earnings of 12.4x (OVERVALUED)
Still, the softer 12.2% annual net income decline and a modest 3.6% revenue growth outlook could unsettle sentiment if execution or demand stumbles.
Find out about the key risks to this Mitsubishi Logistics narrative.
Another View on Mitsubishi Logistics’ Value
The SWS DCF model paints a very different picture for Mitsubishi Logistics. On that framework, the share price of ¥1,543.5 trades well above an estimated future cash flow value of ¥273.26. This flags the stock as heavily overvalued on a pure cash flow basis and raises the question of whether investors are leaning too much on earnings multiples.
Look into how the SWS DCF model arrives at its fair value.
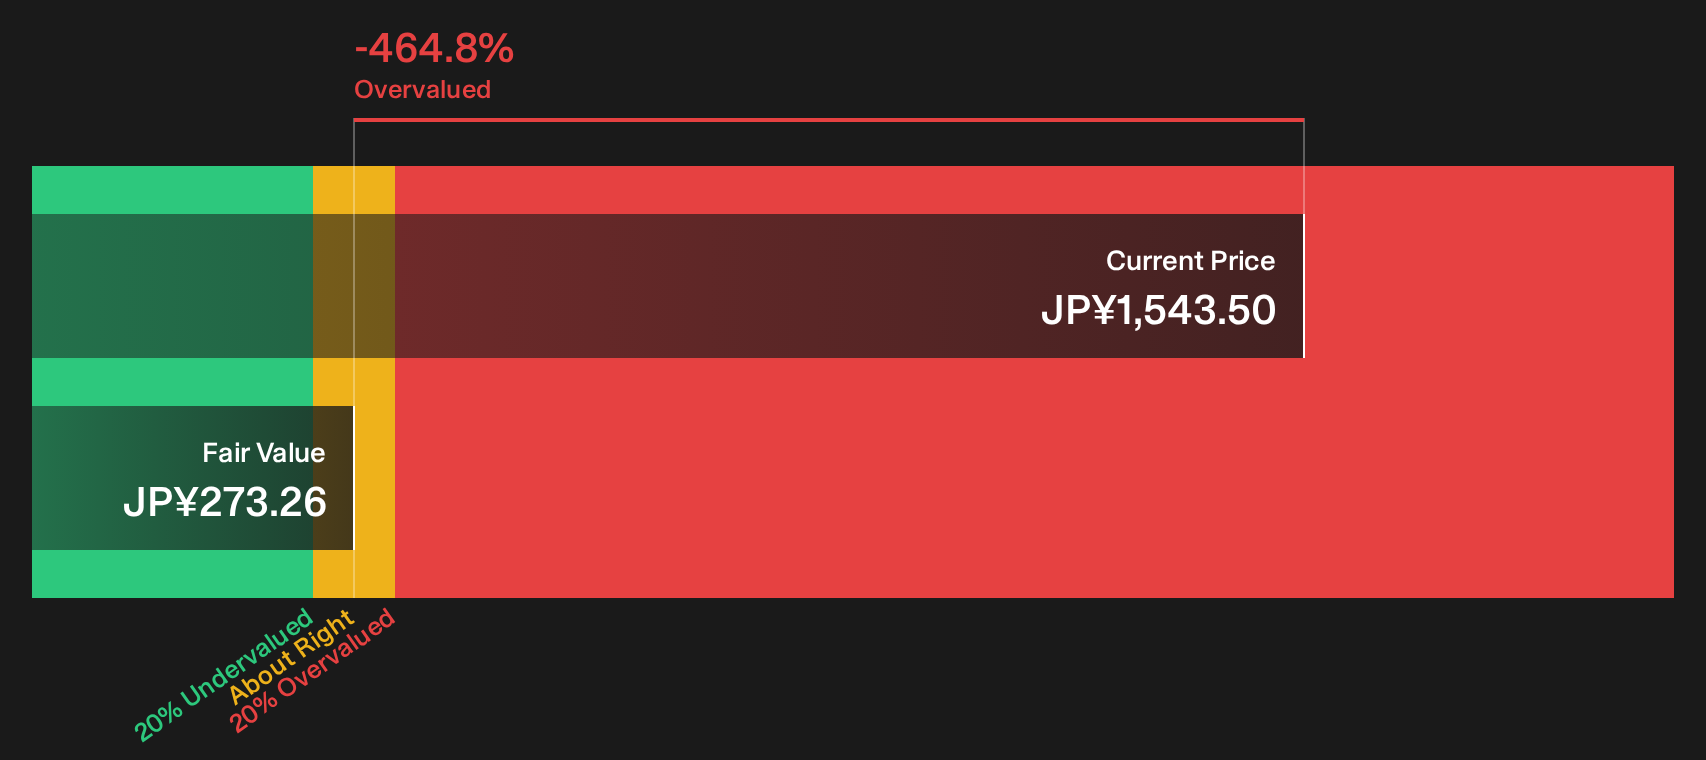
Simply Wall St performs a discounted cash flow (DCF) on every stock in the world every day (check out Mitsubishi Logistics for example). We show the entire calculation in full. You can track the result in your watchlist or portfolio and be alerted when this changes, or use our stock screener to discover 18 high quality undervalued stocks. If you save a screener we even alert you when new companies match - so you never miss a potential opportunity.
Next Steps
Sentiment around Mitsubishi Logistics is clearly split, with both concerns and bright spots in view. To learn more, review the 2 key rewards and 3 important warning signs
Looking for more Mitsubishi Logistics style investment ideas?
If Mitsubishi Logistics has sharpened your focus on valuation and quality, do not stop here. The next opportunity could be sitting in plain sight.
- Target stronger upside potential by scanning a curated set of 18 high quality undervalued stocks that combine compressed valuations with fundamentally sound businesses.
- Lock in steadier income streams by reviewing a hand picked pool of 16 dividend fortresses that prioritise reliable payouts alongside resilient balance sheets.
- Sleep easier at night by concentrating on 12 resilient stocks with low risk scores designed to highlight companies with healthier finances and fewer red flags.
This article by Simply Wall St is general in nature. We provide commentary based on historical data and analyst forecasts only using an unbiased methodology and our articles are not intended to be financial advice. It does not constitute a recommendation to buy or sell any stock, and does not take account of your objectives, or your financial situation. We aim to bring you long-term focused analysis driven by fundamental data. Note that our analysis may not factor in the latest price-sensitive company announcements or qualitative material. Simply Wall St has no position in any stocks mentioned.
Have feedback on this article? Concerned about the content? Get in touch with us directly. Alternatively, email editorial-team@simplywallst.com