


Why Berkshire Hathaway (BRK.B) Is Getting Attention Today
Greg Abel’s portfolio moves put Berkshire Hathaway in the spotlight
Recent shifts inside Berkshire Hathaway (BRK.B) under new CEO Greg Abel, including a larger Alphabet position and smaller Bank of America stake, have put fresh attention on how the conglomerate is allocating capital.
Those portfolio tweaks are landing at a time when Berkshire Hathaway’s 1-year total shareholder return of 5.25% and 3-year total shareholder return of 39.48% point to steady compounding, while a 90-day share price return of 5.19% suggests momentum has been building more recently.
Scan where Berkshire Hathaway’s capital shift toward Alphabet fits in the broader opportunity set by comparing it with our hand-picked list of 16 high quality undiscovered gems for fresh ideas beyond the headline giants.
For a stock like Berkshire Hathaway, which already carries a long track record and a recent 5.19% 90-day gain, the real question now is how much of the valuation upside is still in front rather than already priced in.
Price-to-Earnings of 12.9x: Is it justified?
Berkshire Hathaway trades on a P/E of 12.9x at a last close of $516.76, which looks restrained compared with peers given the recent 36.3% earnings growth and the share price trading 34.8% below one estimate of fair value.
The P/E ratio links what investors pay today to the earnings the business currently generates. For a conglomerate like Berkshire Hathaway, which pulls in $384.7b of revenue from insurance, rail, utilities, manufacturing and retail, this single figure becomes a shorthand for how the market values that mix of earnings streams.
At 12.9x, the market is valuing Berkshire Hathaway well below the US Diversified Financial industry average of 17.4x and also below an estimated fair P/E of 16.2x. That gap suggests investors are assigning a clear discount to the company despite earnings growth of 36.3% over the past year and a net profit margin of 22.3%, levels that do not obviously point to a premium valuation being baked into the price.
Compared with peers on 23.3x and an estimated fair multiple of 16.2x, Berkshire Hathaway’s 12.9x P/E looks materially lower. That spread points to a valuation that could move closer to the fair ratio level if the market reassesses how it prices the company’s profitability and scale.
Explore the SWS fair ratio for Berkshire Hathaway.
Result: Price-to-Earnings of 12.9x (UNDERVALUED)
Still, the Berkshire Hathaway story carries pressure points, including annual net income that recently declined 7.2% and earnings that are closely tied to capital markets and insurance cycles.
Find out about the key risks to this Berkshire Hathaway narrative.
Another view on Berkshire Hathaway’s value
The earlier P/E discussion leans toward Berkshire Hathaway looking inexpensive, but the SWS DCF model presents a different perspective on value. The current $516.76 price is below an estimated future cash flow value of $792.36. That gap raises a simple question for investors: Which signal carries more weight for you?
Look into how the SWS DCF model arrives at its fair value.
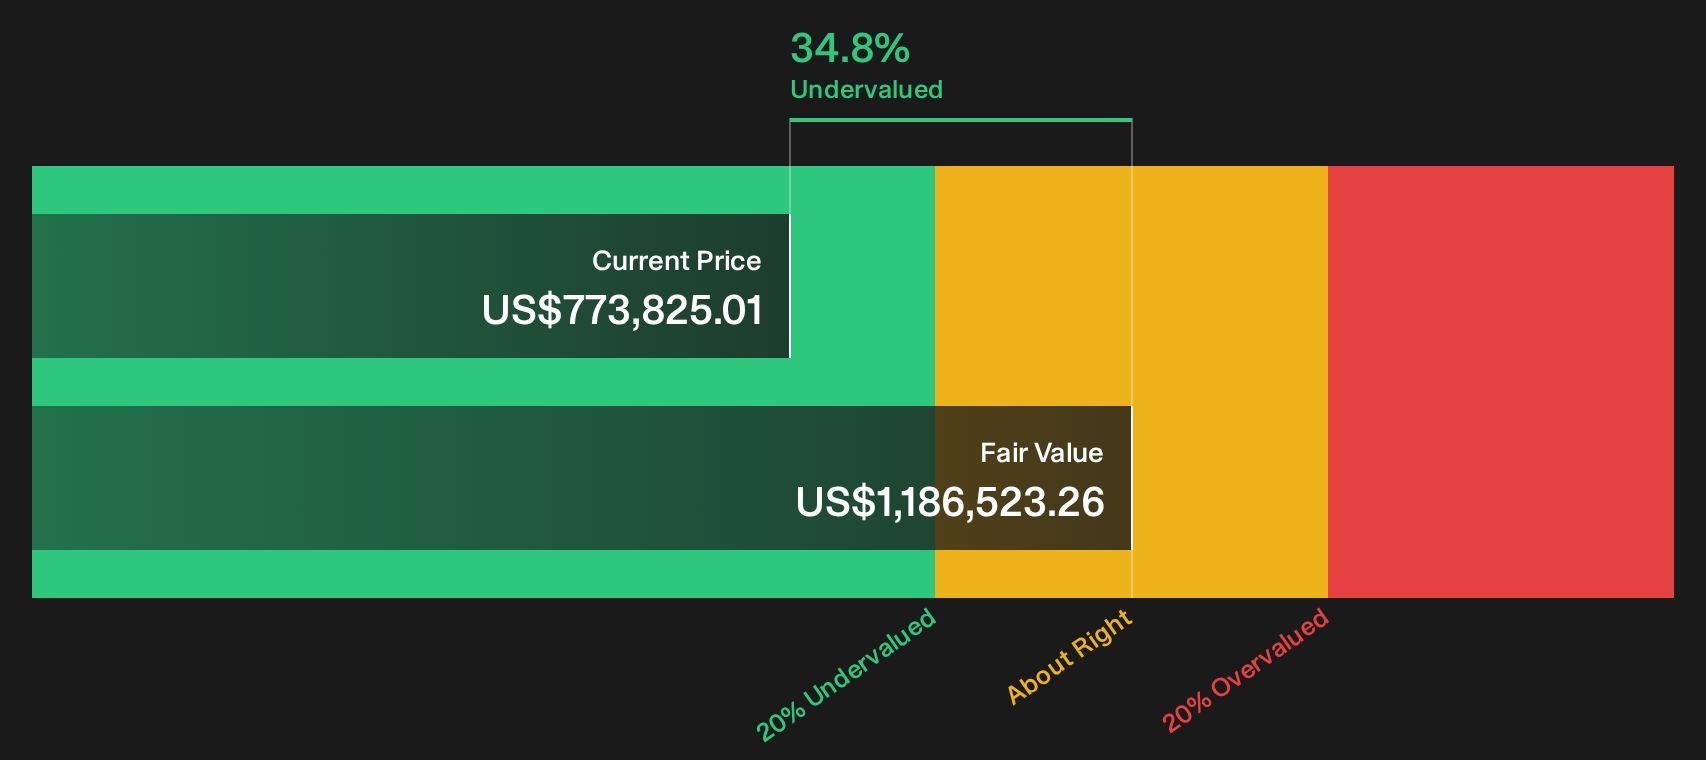
Simply Wall St performs a discounted cash flow (DCF) on every stock in the world every day (check out Berkshire Hathaway for example). We show the entire calculation in full. You can track the result in your watchlist or portfolio and be alerted when this changes, or use our stock screener to discover 34 high quality undervalued stocks. If you save a screener we even alert you when new companies match - so you never miss a potential opportunity.
Next Steps
Mixed signals around Berkshire Hathaway’s valuation and risk profile only matter if you use them. Take a few minutes now to weigh the trade off between its potential upsides and pressure points, then drill into the 3 key rewards and 1 important warning sign
Looking for more Berkshire Hathaway sized ideas?
If you stop at Berkshire Hathaway, you miss the broader field. Use the Simply Wall St screener to spot other opportunities before they move without you.
- Target income resilience by focusing on companies that behave like payout anchors in rough markets through our 6 dividend fortresses.
- Hunt for mispriced quality where solid fundamentals meet discounted valuations using the 34 high quality undervalued stocks.
- Prioritise capital protection first, then upside potential, by zeroing in on companies highlighted in the 11 resilient stocks with low risk scores.
This article by Simply Wall St is general in nature. We provide commentary based on historical data and analyst forecasts only using an unbiased methodology and our articles are not intended to be financial advice. It does not constitute a recommendation to buy or sell any stock, and does not take account of your objectives, or your financial situation. We aim to bring you long-term focused analysis driven by fundamental data. Note that our analysis may not factor in the latest price-sensitive company announcements or qualitative material. Simply Wall St has no position in any stocks mentioned.
Have feedback on this article? Concerned about the content? Get in touch with us directly. Alternatively, email editorial-team@simplywallst.com