


New Hope (ASX:NHC) Shares Confront Shrinking Margins Despite Steady Coal Sales
The market is treating New Hope like just another high yielding coal stock, yet the numbers tell a more complicated story. The share price closed at A$6.49 on 16 September, up around 20% over three months, while full year net profit margin sits near 9% against roughly 25% a year earlier. Revenue of about A$1.8b and statutory net profit after tax of A$161m show a business still generating solid cash, but also wearing a much thinner cushion on every tonne sold. That squeeze is the headline for this result.
Is New Hope a misunderstood cash generator trading at a discount, or is it simply an expensive coal stock with shrinking margins and an uncovered payout? See how the current market price compares with the platform's detailed valuation analysis for New Hope
FY 2026 Earnings Summary
- Revenue (FY 2026 vs. FY 2025): A$1,766.5m vs. A$1,775.5m (broadly flat year on year)
- Net Income, excluding extra items (FY 2026 vs. FY 2025): A$160.96m vs. A$439.37m (sharp decline in earnings level)
- Basic EPS, earnings per share (FY 2026 vs. FY 2025): A$0.191 vs. A$0.520 (material drop in per share profit)
- Net Profit Margin (FY 2026 vs. FY 2025): 9.1% vs. 24.7% (significant margin compression)
Prefer clean charts over another dense block of earnings tables and footnotes? See New Hope's full financial picture, including how the latest margin compression shows up across valuation and cash generation, in the company report for New Hope.
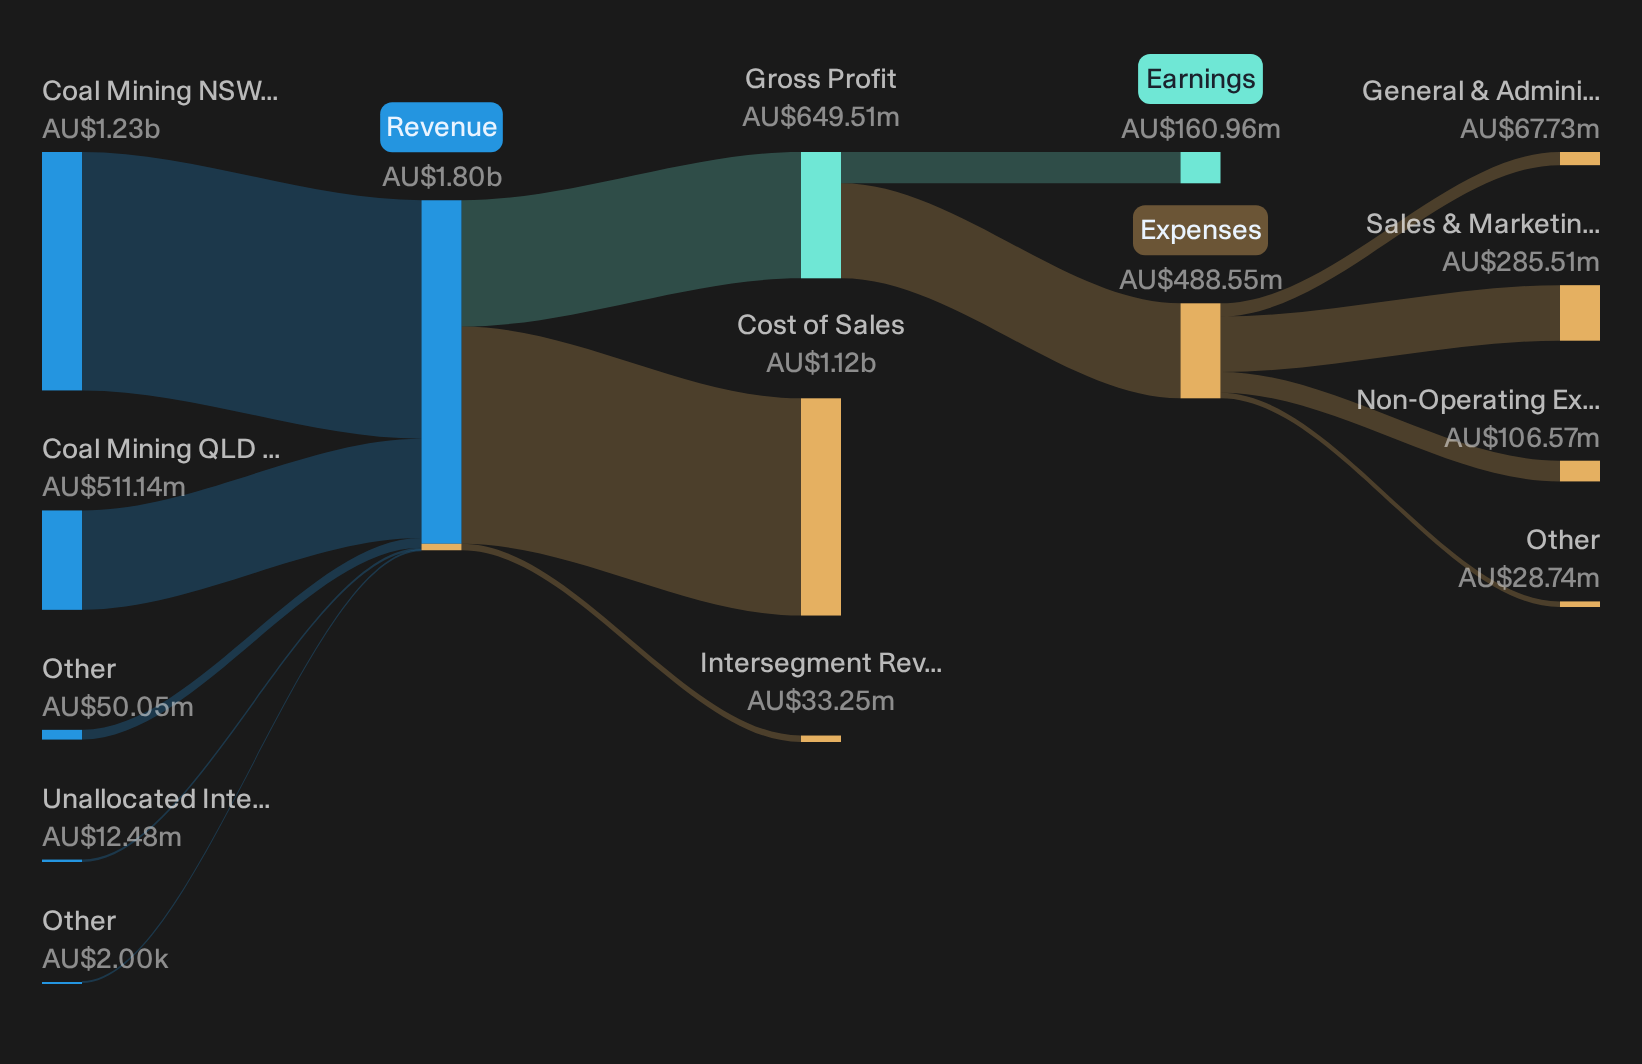
New Hope’s Bull Story Meets Margin Reality
Bulls argue New Hope can turn tight seaborne supply and Asian demand into fat, durable cash flows. The latest year shows only part of that picture coming through. On the volume side, the business cleared important hurdles. Saleable production reached 11.5 mt and coal sales 11.8 mt, both above guidance, with New Acland lifting to 3.3 mt and Bengalla running at nameplate output. That supports the claim that mine ramps and logistics are moving in the right direction.
Profitability tells a tougher story. Revenue held near A$1.8b and average realised coal price was about A$145/t, yet underlying EBITDA was A$514m and statutory NPAT A$161m, leaving group net margin near 9% compared with roughly 25% a year earlier. A margin of about A$45/t shows low cost assets still generate healthy cash, but the sharp earnings drop tests the idea that New Hope can turn industry tightness into widening, rather than shrinking, margins.
See whether New Hope’s production beats and cash generation line up with what the street expects, and how the A$6.49 share price compares with the current consensus price target analysis for New Hope.New Hope Bears Get Margin Ammo, Not Volume Failure
Bears worry that New Hope’s reliance on thermal coal and regulatory pressure will squeeze earnings even when tonnes move as planned. This result leans their way on profitability, not on operations. Volumes cleared guidance, Bengalla and New Acland hit key output milestones and the business still earned about A$45/t. Yet net profit margin fell from 24.7% to 9.1% on flat revenue, with EPS dropping from A$0.520 to A$0.191. That is a clear miss against the idea that low costs and logistics optimisation alone can protect earnings power.
Concerns around higher compliance and input costs show up in group FOB cash costs at A$88.9/t, above prior levels, while the average realised price near A$145/t moved lower. Cash generation and a fully franked A$0.30 dividend push back on insolvency style fears, but the print validates bearish questions about how much profit the coal portfolio can retain as external pressures build.
Scan New Hope’s compressed 9.1% margin and uncovered 6.16% dividend yield, then review our full risk analysis for New Hope which shows 2 important warning signsStay Ahead Of Your Next Move
New Hope’s compressed 9.1% margin and A$0.30 dividend make timing matter, so register for free with Simply Wall St and add it to a Watchlist to track price against fair value and wait for the entry point that fits your plan. Once you are in the position, keep control of your holdings with the Portfolio Command Center that filters noise and highlights only the key changes that affect your thesis. For longer term conviction, tap into crowd insight through the Community to see how other investors are reacting to the same numbers you are watching. By surfacing hidden catalysts and risks early, Simply Wall St helps you act with confidence and stay a step ahead of the market.
Seeking Fresh Alternatives Beyond New Hope
Markets move fast, and the next breakout ideas rarely stay under the radar for long. Scan these fresh stock pools before momentum gets caught by the crowd and act now.
- Spot resilient compounders before they start flying by reviewing 3 resilient stocks with low risk scores that have already cleared strict balance sheet and risk filters, while they are still under the radar for now.
- Focus on future cash engines rather than stories by scanning 76 profitable AI stocks that aren't just burning cash that already convert AI buzz into real earnings before the ideal entry window starts dropping away.
- Concentrate on metal producers with real operating momentum by checking 35 elite gold producer stocks while pricing dislocations still matter and before the next leg of investor interest builds.
This article by Simply Wall St is general in nature. We provide commentary based on historical data and analyst forecasts only using an unbiased methodology and our articles are not intended to be financial advice. It does not constitute a recommendation to buy or sell any stock, and does not take account of your objectives, or your financial situation. We aim to bring you long-term focused analysis driven by fundamental data. Note that our analysis may not factor in the latest price-sensitive company announcements or qualitative material. Simply Wall St has no position in any stocks mentioned.
Have feedback on this article? Concerned about the content? Get in touch with us directly. Alternatively, email editorial-team@simplywallst.com