


Intercontinental Exchange (ICE) Could Be 15% Undervalued After Record August Trading
Intercontinental Exchange (ICE) just released August 2026 operating metrics, showing broad-based gains in trading activity and open interest across energy, agriculture, metals, financials, and NYSE equity options, which has quickly refocused investor attention on the stock.
Intercontinental Exchange shares trade at US$156.90, with short-term price momentum easing after a strong 90-day share price return of 16.58%. The 1-year total shareholder return has declined 7.24%, while the 3- and 5-year total shareholder returns remain above 40%.
Scan other exchange and trading platforms showing similar liquidity momentum through a curated list of 38 power grid technology and infrastructure stocks that aligns with Intercontinental Exchange's role in critical market infrastructure.
Intercontinental Exchange just delivered record August activity, yet the share price has eased after a strong 90-day run. Are investors reacting more to sentiment swings than to what the underlying business is actually doing on the ground?
Most Popular Narrative: 15% Undervalued
Intercontinental Exchange is trading at $156.90 against a widely followed fair value estimate of about $183.93. This raises the question of whether the recent share price pause fully reflects the business momentum investors see playing out over the next few years.
The continued expansion and integration of ICE's global electronic trading platforms across asset classes, including record energy, interest rate, and equity contract volumes, suggests ongoing benefits from digitization and greater market electronification. These factors are described as likely to support sustained double-digit growth in transaction revenues and operating leverage.
See why 36 investors see Intercontinental Exchange as 15% undervalued.
Result: Fair Value of $183.93 (UNDERVALUED)
Still, the bullish narrative around Intercontinental Exchange could be challenged if competition in perpetual futures pressures fees, or if mortgage tech integrations drag on profitability.
Find out about the key risks to this Intercontinental Exchange narrative.
Another View: Intercontinental Exchange Through Cash Flows
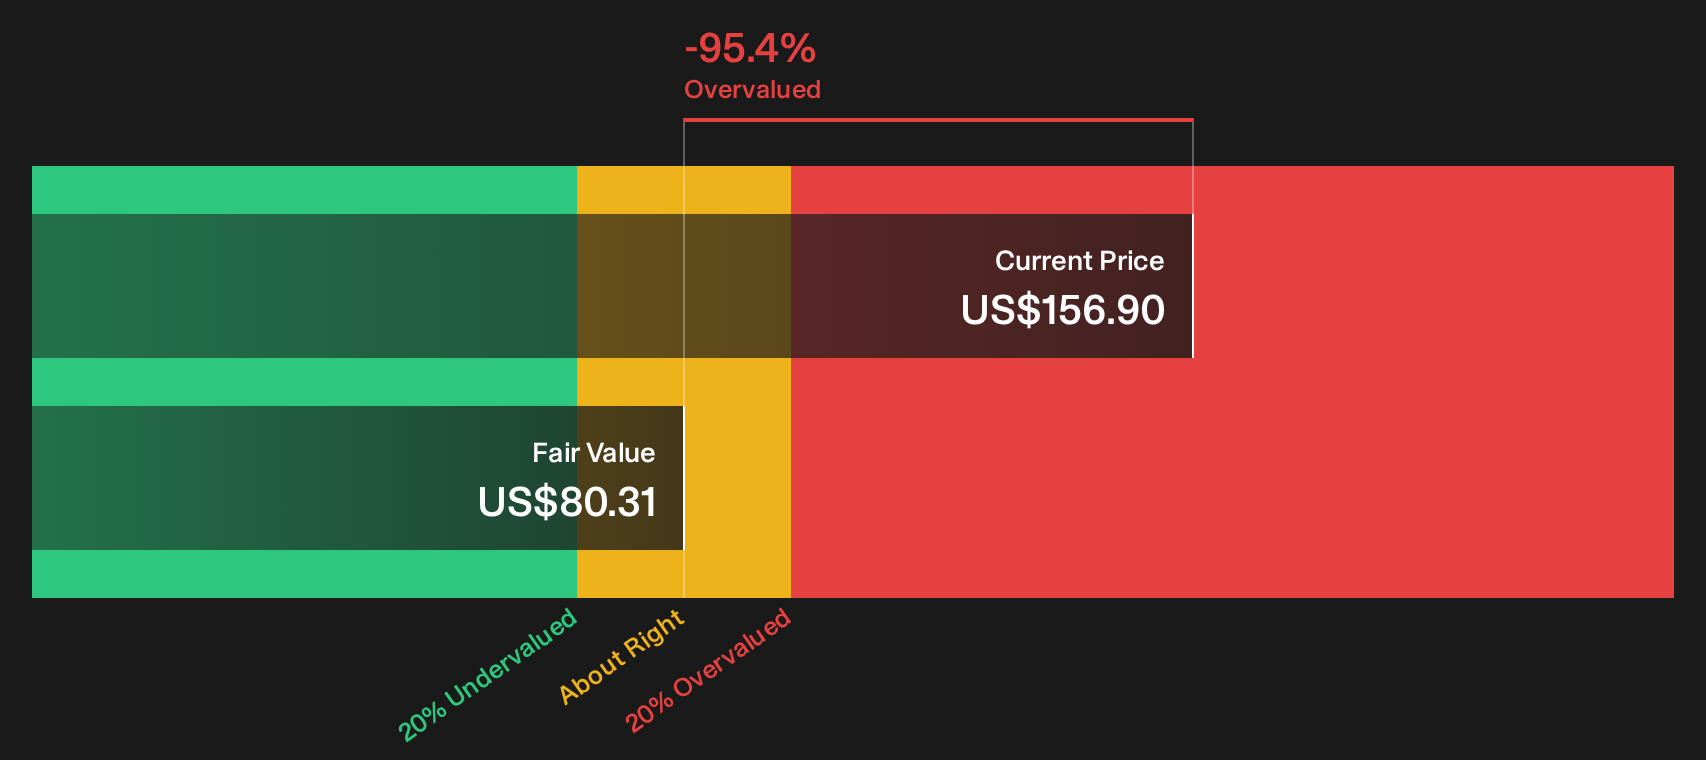
The earlier fair value of $183.93 for Intercontinental Exchange leans on analyst earnings projections and a target P/E. A different lens tells a harsher story. The SWS DCF model puts future cash flow value at $80.31 per share, well below the current $156.90 price, which points to an overvalued signal on this framework.
That gap suggests investors are paying a large premium to this cash flow estimate, likely because they place more weight on earnings power and business quality than on this specific model output. The question for you is simple: Which set of assumptions feels more realistic when real money is on the line?
Look into how the SWS DCF model arrives at its fair value.
Simply Wall St performs a discounted cash flow (DCF) on every stock in the world every day (check out Intercontinental Exchange for example). We show the entire calculation in full. You can track the result in your watchlist or portfolio and be alerted when this changes, or use our stock screener to discover 34 high quality undervalued stocks. If you save a screener we even alert you when new companies match - so you never miss a potential opportunity.
Next Steps
Mixed sentiment hangs over Intercontinental Exchange after these metrics, which is exactly why you should move quickly, study the numbers yourself, and weigh both the concerns and the upside through 3 key rewards and 2 important warning signs.
Ready for more investment ideas beyond Intercontinental Exchange?
Do not stop at a single ticker. Use these focused stock ideas to pressure test your thinking, find fresh angles, and keep your watchlist ahead of the crowd.
- Hunt for potential mispricing by scanning a curated set of high quality opportunities through 34 high quality undervalued stocks.
- Strengthen your income stream by reviewing companies that match your yield and stability preferences using 6 dividend fortresses.
- Prioritise resilience by filtering for companies with robust finances inside the list of solid balance sheet and fundamentals (22 results).
This article by Simply Wall St is general in nature. We provide commentary based on historical data and analyst forecasts only using an unbiased methodology and our articles are not intended to be financial advice. It does not constitute a recommendation to buy or sell any stock, and does not take account of your objectives, or your financial situation. We aim to bring you long-term focused analysis driven by fundamental data. Note that our analysis may not factor in the latest price-sensitive company announcements or qualitative material. Simply Wall St has no position in any stocks mentioned.
Have feedback on this article? Concerned about the content? Get in touch with us directly. Alternatively, email editorial-team@simplywallst.com