


Is Jungheinrich (XTRA:JUN3) Undervalued Or Is Its 68.1x P/E Already Too Pricey?
Jungheinrich (XTRA:JUN3) has caught investor attention after a recent share price move, with the stock closing at €25.24. Recent returns show mixed short term performance and a weaker picture over longer periods.
Recent trading reflects that mixed picture. The 1-day share price return of 1.77% comes after a 7-day share price decline of 7.88%. Over the longer term, total shareholder return over five years is down 32.82%, suggesting momentum has been fading rather than building.
Scan beyond Jungheinrich's mixed momentum and compare it with a hand picked 38 robotics and automation stocks shaping the future of intralogistics and automation.
After Jungheinrich’s latest move to €25.24, the gap to analyst targets and intrinsic value estimates is wide enough to matter. Where does a reasonable fair value range for this stock stand now?
Price-to-Earnings of 68.1x: Is it justified?
On simple earnings terms, Jungheinrich looks expensive. The stock closed at €25.24, yet the current P/E ratio sits at 68.1x, well above what many investors might expect for a mature industrial group.
The P/E multiple compares what you pay today to the earnings the business is generating right now. For a material handling and intralogistics specialist like Jungheinrich, this ratio often reflects how much the market is willing to pay for its profit profile and any potential recovery in profitability after a tough period.
That context matters. Jungheinrich currently trades on a P/E of 68.1x. The estimated fair P/E from the SWS fair ratio framework is 43x. The gap is wide, and it suggests the market price could move closer to that 43x level if sentiment or earnings do not catch up with expectations.
Against peers, the valuation looks even richer. The wider German Machinery industry trades on an average P/E of 16.3x and the immediate peer group on 23.3x, so Jungheinrich’s 68.1x earnings multiple is priced far above both sector and peer benchmarks.
Explore the SWS fair ratio for Jungheinrich.
Result: Price-to-Earnings of 68.1x (OVERVALUED)
Still, the Jungheinrich story can change quickly if earnings momentum stalls or if intralogistics customers delay automation projects, which could pressure new equipment orders.
Find out about the key risks to this Jungheinrich narrative.
Another View on Jungheinrich’s Value
That rich P/E story is only half the picture. Our DCF model points to a fair value of about €35.48 per share, with Jungheinrich trading around €25.24. On that lens, the stock appears undervalued, which raises a simple question: Which signal do you trust more, price or cash flows?
Look into how the SWS DCF model arrives at its fair value.
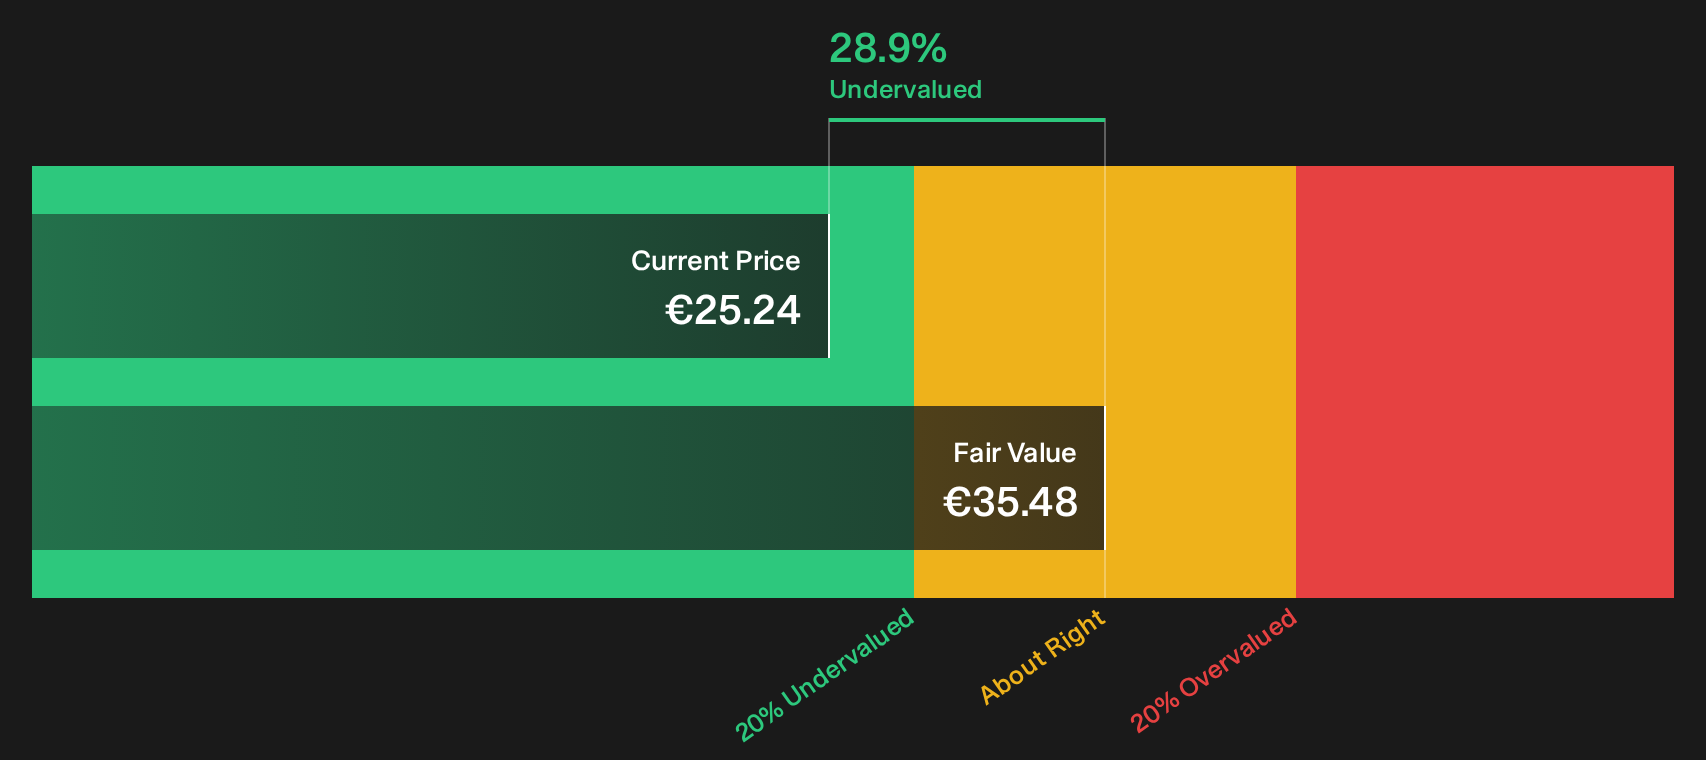
Simply Wall St performs a discounted cash flow (DCF) on every stock in the world every day (check out Jungheinrich for example). We show the entire calculation in full. You can track the result in your watchlist or portfolio and be alerted when this changes, or use our stock screener to discover 194 high quality undervalued stocks. If you save a screener we even alert you when new companies match - so you never miss a potential opportunity.
Next Steps
Valuation signals around Jungheinrich are pulling in different directions, so it pays to move quickly, review the full data set, and weigh both the concerns and the potential upside for yourself with 2 key rewards and 3 important warning signs
Looking for more investment ideas beyond Jungheinrich?
If Jungheinrich has you thinking harder about price, quality, and risk, it makes sense to widen the search using structured stock ideas instead of guesswork.
- Target resilient balance sheets and steady fundamentals by scanning our list of solid balance sheet and fundamentals (195 results) before conditions change and quality gets repriced.
- Hunt for mispriced opportunities with strong business profiles by working through the 622 high quality undiscovered gems that many investors may not be watching yet.
- Dial down portfolio risk while staying invested by focusing on the 102 resilient stocks with low risk scores to help smooth out the rougher stretches of the market.
This article by Simply Wall St is general in nature. We provide commentary based on historical data and analyst forecasts only using an unbiased methodology and our articles are not intended to be financial advice. It does not constitute a recommendation to buy or sell any stock, and does not take account of your objectives, or your financial situation. We aim to bring you long-term focused analysis driven by fundamental data. Note that our analysis may not factor in the latest price-sensitive company announcements or qualitative material. Simply Wall St has no position in any stocks mentioned.
Have feedback on this article? Concerned about the content? Get in touch with us directly. Alternatively, email editorial-team@simplywallst.com