


Asian Market Gems Estimated Below Value In September 2026
In September 2026, the Asian markets are navigating a complex landscape influenced by geopolitical tensions and rising energy prices, which have stoked inflation concerns across the globe. Amid this volatility, investors are keenly seeking opportunities in undervalued stocks that may offer potential for growth as market conditions evolve. Identifying such stocks often involves looking at companies with strong fundamentals and resilience in challenging economic environments.
Top 10 Undervalued Stocks Based On Cash Flows In Asia
| Name | Current Price | Fair Value (Est) | Discount (Est) |
| Wacom (TSE:6727) | ¥826.00 | ¥1601.68 | 48.4% |
| Thai Vegetable Oil (SET:TVO) | THB27.00 | THB51.97 | 48% |
| Rakus (TSE:3923) | ¥1084.00 | ¥2071.97 | 47.7% |
| P.S.P. Specialties (SET:PSP) | THB7.75 | THB14.84 | 47.8% |
| PAL GROUP Holdings (TSE:2726) | ¥1508.00 | ¥2852.55 | 47.1% |
| Niterra (TSE:5334) | ¥7262.00 | ¥13776.68 | 47.3% |
| Ichikoh Industries (TSE:7244) | ¥556.00 | ¥1070.21 | 48% |
| Dongwon Industries (KOSE:A006040) | ₩36650.00 | ₩71048.01 | 48.4% |
| BuySell TechnologiesLtd (TSE:7685) | ¥2933.00 | ¥5579.71 | 47.4% |
| AK Medical Holdings (SEHK:1789) | HK$4.88 | HK$9.60 | 49.2% |
We're going to check out a few of the best picks from our screener tool.
Wacom (TSE:6727)
Overview: Wacom Co., Ltd. develops, manufactures, and sells pen tablets and related software in Japan and internationally, with a market cap of ¥109.66 billion.
Operations: The company's revenue is primarily derived from its Technology Solution Business, which accounts for ¥73.53 billion, and its Branded Products Business, contributing ¥34.61 billion.
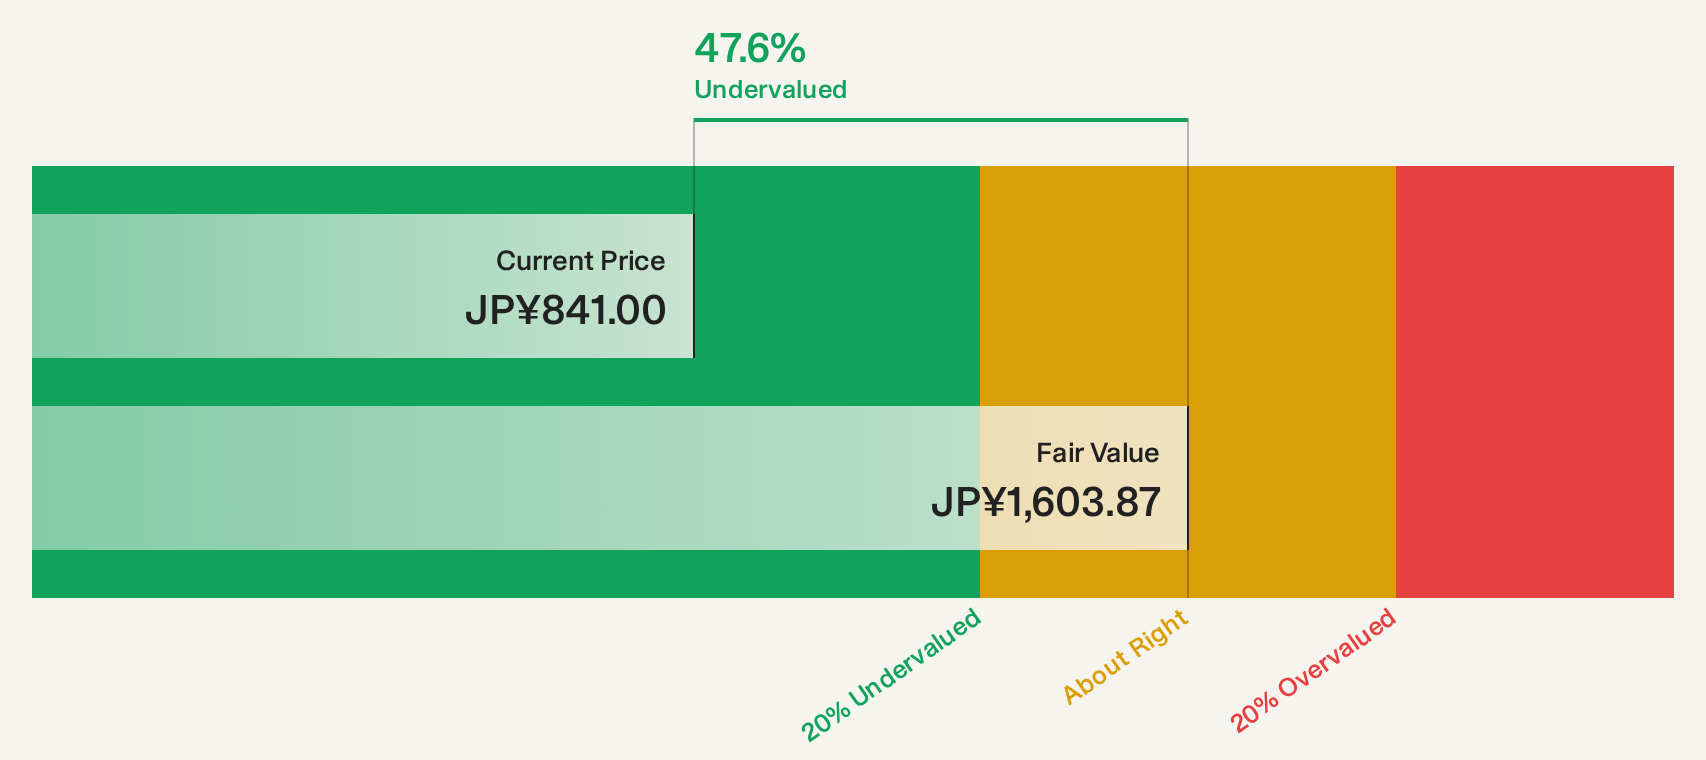
Estimated Discount To Fair Value: 48.4%
Wacom is trading at ¥826, significantly below its estimated future cash flow value of ¥1601.68, indicating potential undervaluation. Despite earnings growth of 138.2% last year and a forecasted annual growth rate of 5.3%, this is slower than the broader Japanese market's expected growth. Recent Q1 results showed increased net income to ¥2,046 million from ¥1,638 million the previous year, though sales declined slightly. The company completed a share buyback worth approximately ¥1.5 billion in June 2026.
- The analysis detailed in our Wacom growth report hints at robust future financial performance.
- Delve into the full analysis health report here for a deeper understanding of Wacom.
Fuji Seal International (TSE:7864)
Overview: Fuji Seal International, Inc. specializes in the planning, development, manufacturing, and sales of packaging systems and has a market cap of ¥176.11 billion.
Operations: Revenue Segments (in millions of ¥): Labels: ¥123,456; Shrink Sleeve Labels: ¥78,910; Spouted Pouches: ¥45,678; Machinery: ¥34,567.
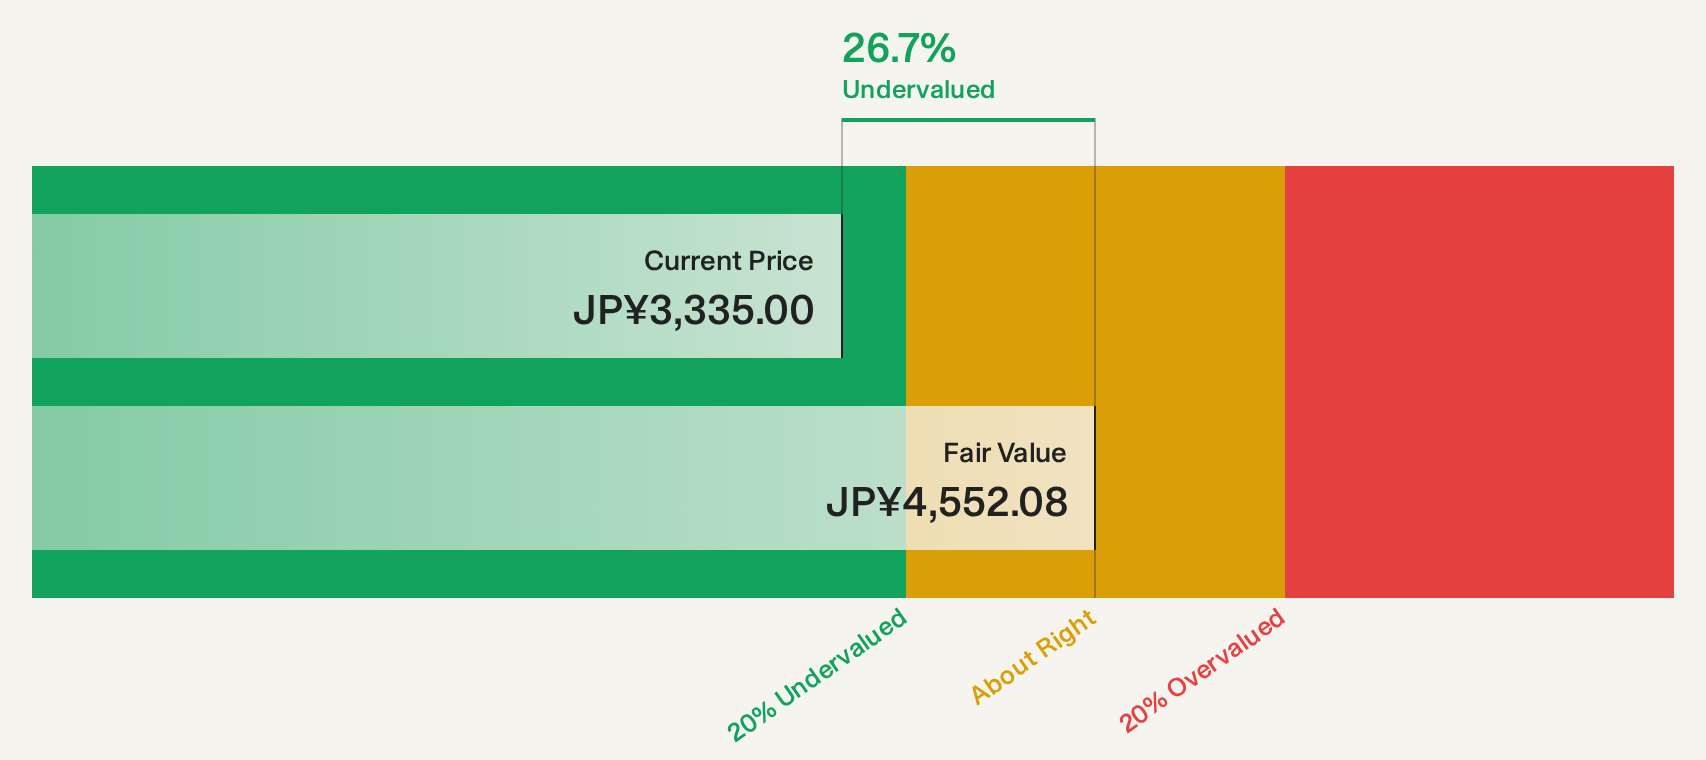
Estimated Discount To Fair Value: 27.5%
Fuji Seal International is trading at ¥3,300, below its estimated future cash flow value of ¥4,552.08, suggesting it may be undervalued. Despite a 65.2% earnings growth last year and Q1 net income rising to ¥4,954 million from ¥4,334 million the previous year, earnings are forecast to decline by 5.8% annually over the next three years. The dividend yield of 2.64% is not well covered by free cash flows and was recently adjusted downward for fiscal year-end expectations.
- Insights from our recent growth report point to a promising forecast for Fuji Seal International's business outlook.
- Take a closer look at Fuji Seal International's balance sheet health here in our report.
NSD (TSE:9759)
Overview: NSD Co., Ltd. offers a range of IT solutions in Japan and has a market cap of ¥217.45 billion.
Operations: NSD Co., Ltd. generates revenue from various segments, including ¥18.37 billion from the Solution Business and ¥102.92 billion across System Development in Financial IT (¥36.30 billion), Industrial IT (¥28.44 billion), Social Infrastructure IT (¥24.63 billion), and IT Infrastructure Construction (¥13.54 billion).
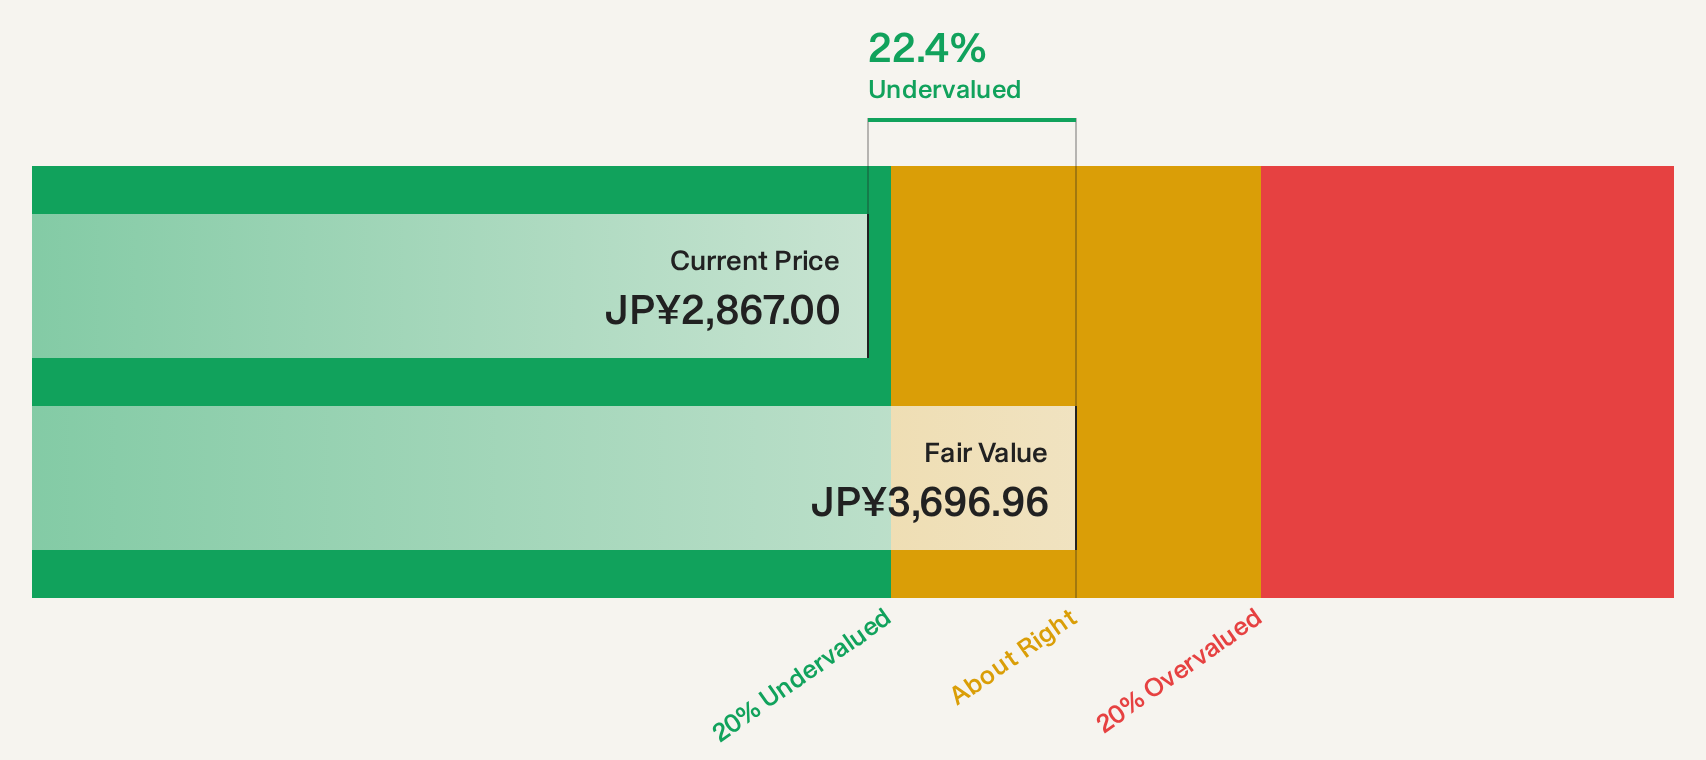
Estimated Discount To Fair Value: 21.8%
NSD Co., Ltd. is trading at ¥2,878, below its estimated future cash flow value of ¥3,680.68, indicating it is undervalued based on cash flows. Recent sales growth with August net sales reaching ¥10,510 million from ¥9,710 million a year ago supports this valuation. Despite earnings forecast to grow slower than the JP market at 7.3% annually and revenue growth slightly above market expectations at 6.7%, NSD remains an attractive option for value investors due to its reliable dividend yield of 3.37%.
- The growth report we've compiled suggests that NSD's future prospects could be on the up.
- Dive into the specifics of NSD here with our thorough financial health report.
Key Takeaways
- Delve into our full catalog of 82 Undervalued Asian Stocks Based On Cash Flows here.
- Hold shares in these firms? Setup your portfolio in Simply Wall St to seamlessly track your investments and receive personalized updates on your portfolio's performance.
- Unlock the power of informed investing with Simply Wall St, your free guide to navigating stock markets worldwide.
Seeking Other Investments?
- Explore high-performing small cap companies that haven't yet garnered significant analyst attention.
- Diversify your portfolio with solid dividend payers offering reliable income streams to weather potential market turbulence.
- Fuel your portfolio with companies showing strong growth potential, backed by optimistic outlooks both from analysts and management.
This article by Simply Wall St is general in nature. We provide commentary based on historical data and analyst forecasts only using an unbiased methodology and our articles are not intended to be financial advice. It does not constitute a recommendation to buy or sell any stock, and does not take account of your objectives, or your financial situation. We aim to bring you long-term focused analysis driven by fundamental data. Note that our analysis may not factor in the latest price-sensitive company announcements or qualitative material. Simply Wall St has no position in any stocks mentioned.
Have feedback on this article? Concerned about the content? Get in touch with us directly. Alternatively, email editorial-team@simplywallst.com