


Why Seven Bank (TSE:8410) Is Getting Attention Today
Seven Bank (TSE:8410) just released preliminary August operating data, giving investors a fresh snapshot of its ATM-driven business model and transaction volumes across Japan.
Recent share price action suggests interest in Seven Bank is building, with a 20.8% 90 day share price return and 14.23% year to date. The 1 year total shareholder return of 23.33% and 5 year total shareholder return of 64.10% point to longer term momentum.
Track how Seven Bank’s ATM-driven momentum compares with other financials by scanning our hand picked list of 12 resilient stocks with low risk scores that may offer a different balance of growth and resilience.
That kind of move in Seven Bank after steady operating data invites a simple tension. Are investors responding to the ATM business itself, or mostly to changing sentiment around the stock’s valuation setup?
Preferred P/E of 25.3x for Seven Bank: Is it justified?
On valuation, Seven Bank is trading on a P/E of 25.3x, which sits well above both its banking peers and an internally estimated fair level, even as the share price of ¥344.4 screens at an 18.3% discount to one DCF based fair value estimate of ¥421.32.
The P/E ratio compares what investors are willing to pay today for each unit of current earnings. For a lender that earns money from ATM fees, banking services, and related financial products, P/E often reflects how confident the market is in the stability and growth of those profits.
Seven Bank’s current P/E of 25.3x is described as expensive when stacked against the JP Banks industry average of 15.9x and a peer group average of 17.3x. It is also described as high compared with an estimated fair P/E of 15.7x, a level the market could move towards if expectations around earnings growth, profitability, or risk profile settle closer to sector norms.
The contrast is stark. Seven Bank’s earnings are forecast to grow 13.44% per year, and 13.4% per year relative to the JP market’s 8.8% earnings growth outlook. Yet the stock is still flagged as expensive on this P/E yardstick that already incorporates those expectations. At the same time, the DCF based assessment that ¥344.4 is 18.3% below an estimated future cash flow value of ¥421.32 shows a very different picture, indicating that cash flow assumptions and multiple based views are pointing in different directions.
Explore the SWS fair ratio for Seven Bank.
Result: Price-to-Earnings of 25.3x (OVERVALUED)
Still, if ATM usage patterns or fee structures weaken, or if analyst expectations anchored around the ¥302 price target gain traction, Seven Bank’s rich P/E could face pressure.
Find out about the key risks to this Seven Bank narrative.
Another View on Seven Bank’s value
There is a clear clash between the rich 25.3x P/E for Seven Bank and our DCF based estimate that ¥344.4 sits 18.3% below a future cash flow value of ¥421.32. One lens points to overpaying for earnings. The other hints at a discount to long term cash generation. Which signal do you trust more?
Look into how the SWS DCF model arrives at its fair value.
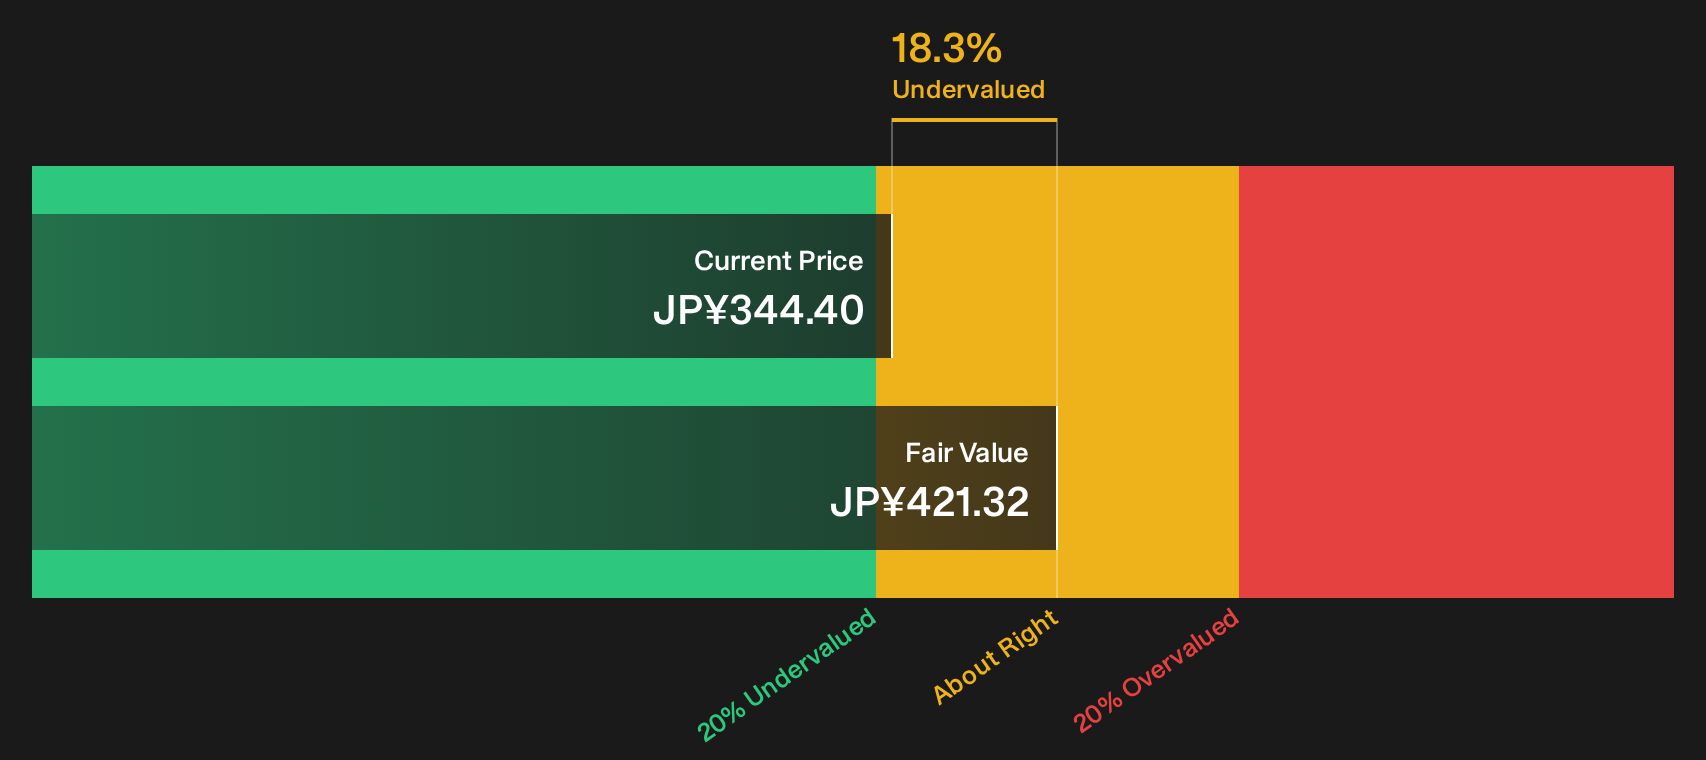
Simply Wall St performs a discounted cash flow (DCF) on every stock in the world every day (check out Seven Bank for example). We show the entire calculation in full. You can track the result in your watchlist or portfolio and be alerted when this changes, or use our stock screener to discover 18 high quality undervalued stocks. If you save a screener we even alert you when new companies match - so you never miss a potential opportunity.
Next Steps
Curious whether the market is getting ahead of itself on Seven Bank or still missing part of the story? Act while the data is fresh and weigh the upside against the downside by checking the 3 key rewards and 2 important warning signs.
Looking for more Seven Bank style investment ideas?
Do not stop at Seven Bank. Use the same lens on other opportunities so your portfolio reflects the quality and risk balance you actually want.
- Target quality at a discount by checking companies on our 18 high quality undervalued stocks that combine solid fundamentals with prices that may not fully reflect them.
- Strengthen your income stream by scanning the 17 dividend fortresses that focus on yields above 5% with an emphasis on resilience.
- Tighten your risk profile by reviewing our list of solid balance sheet and fundamentals (20 results) to see businesses backed by stronger financial foundations.
This article by Simply Wall St is general in nature. We provide commentary based on historical data and analyst forecasts only using an unbiased methodology and our articles are not intended to be financial advice. It does not constitute a recommendation to buy or sell any stock, and does not take account of your objectives, or your financial situation. We aim to bring you long-term focused analysis driven by fundamental data. Note that our analysis may not factor in the latest price-sensitive company announcements or qualitative material. Simply Wall St has no position in any stocks mentioned.
Have feedback on this article? Concerned about the content? Get in touch with us directly. Alternatively, email editorial-team@simplywallst.com