


This Utility ETF Says the AI Trade Is Over
I don’t make the news, I just report it, albeit through a lens biased by 40 years of charting.
So when I look at what’s happening with the S&P 500 Utilities Sector SPDR (XLU), the most prominent ETF devoted to the utilities sector, I simply translate what I see.
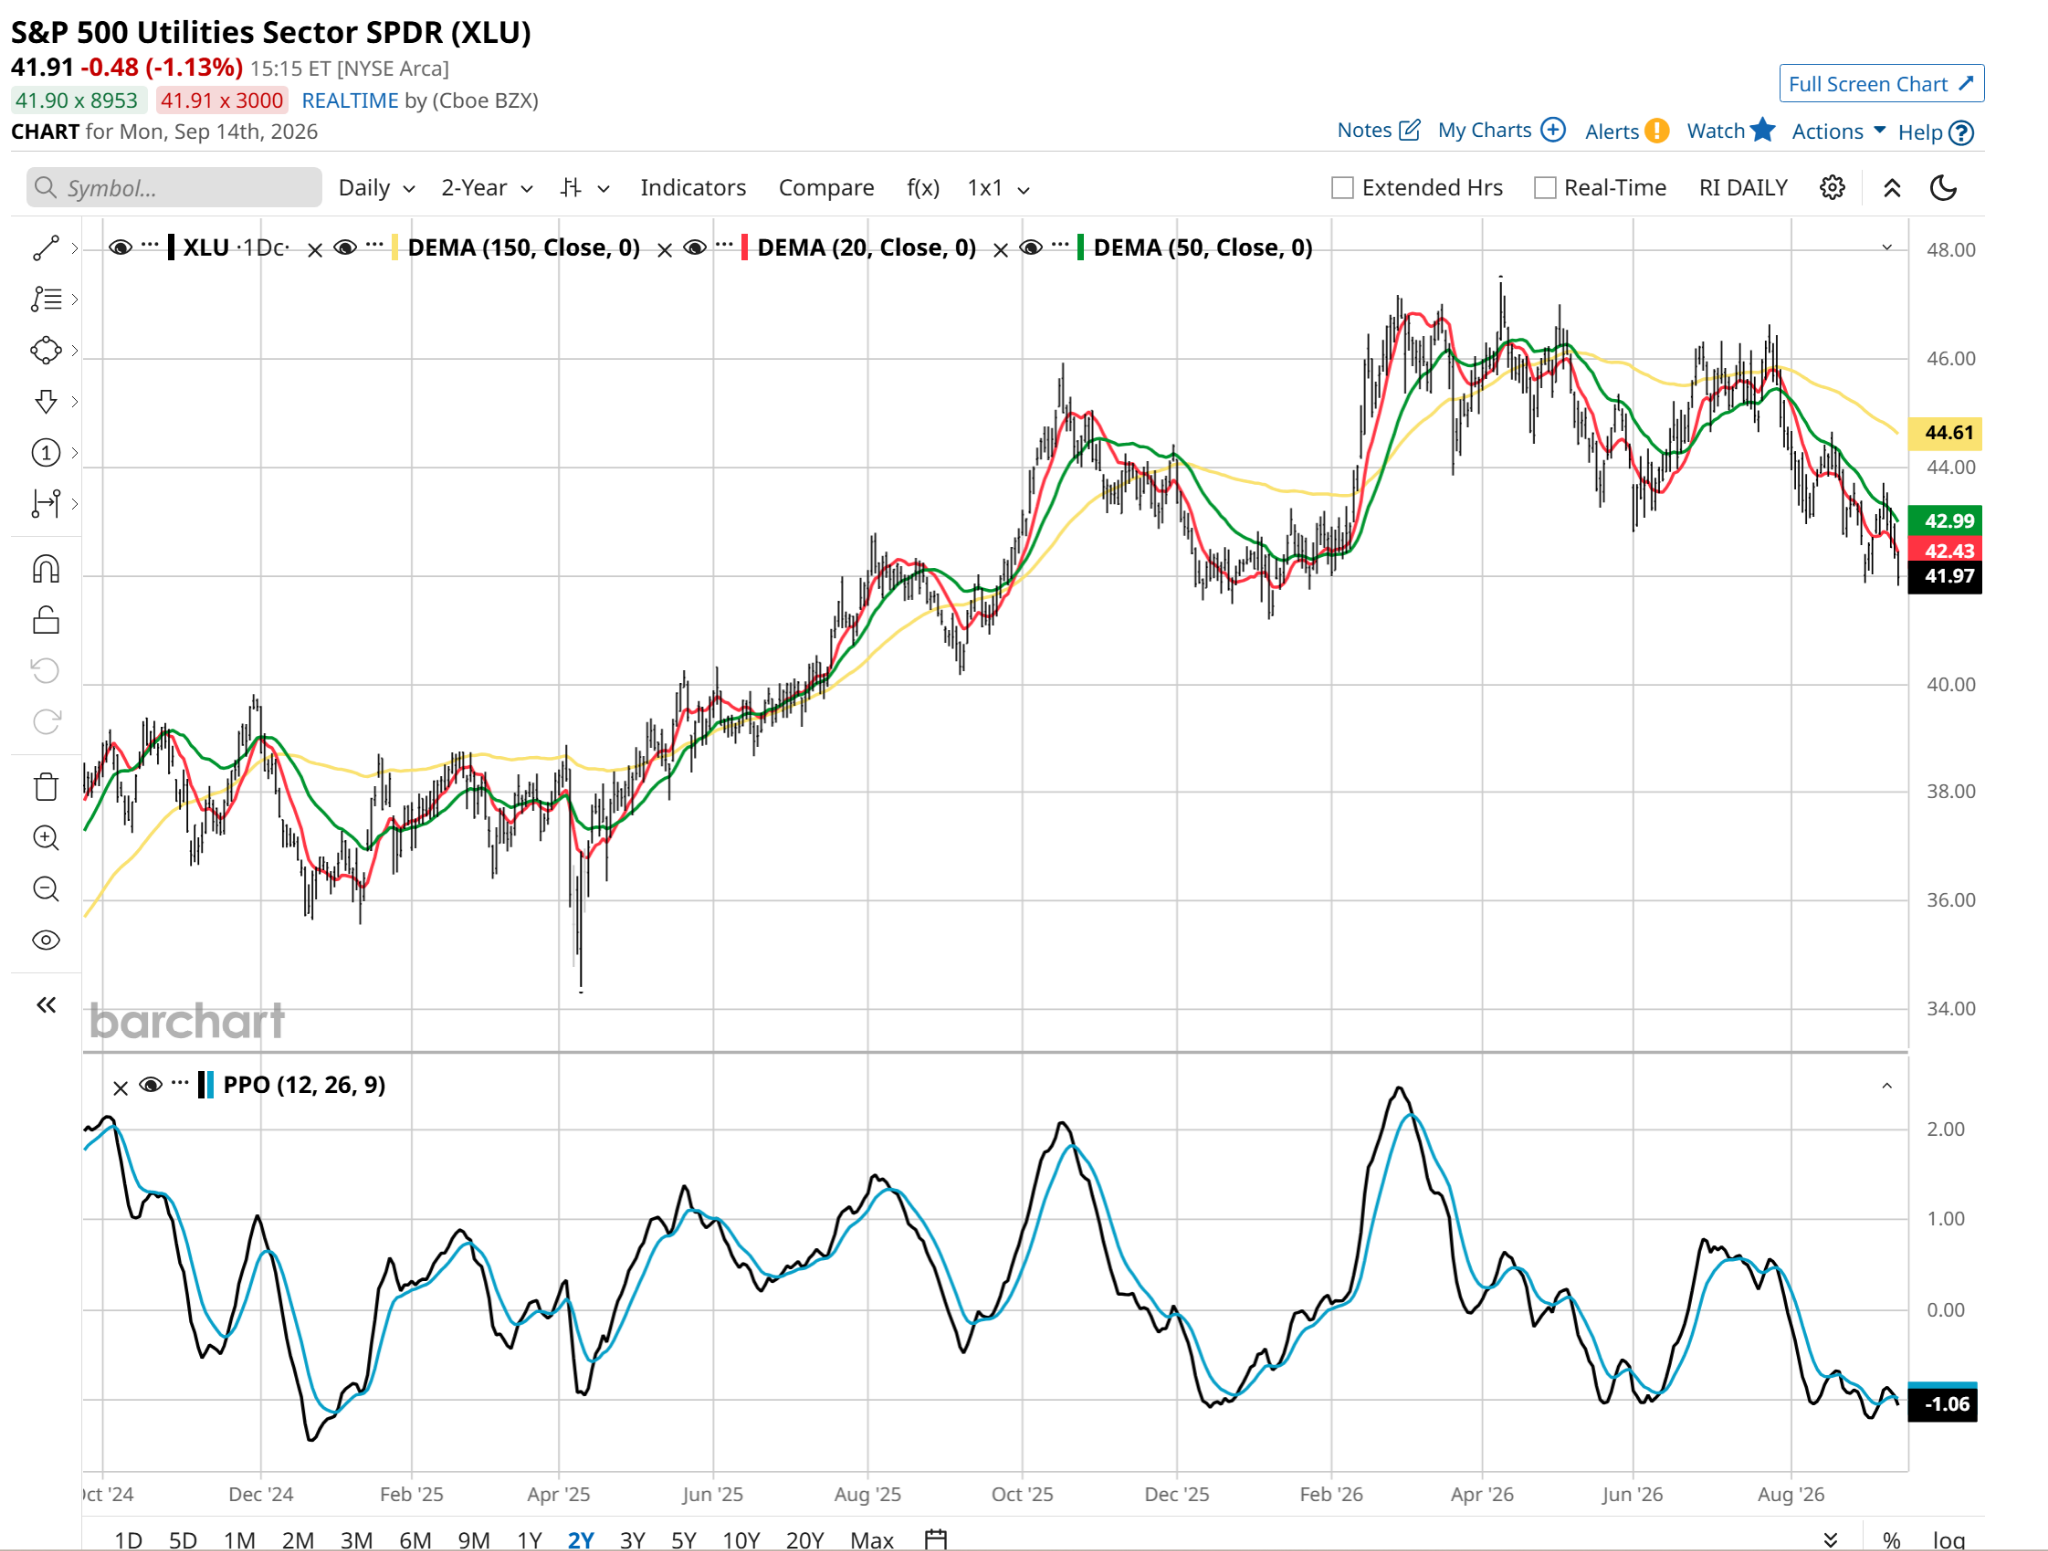
What I see above is a sector that is losing its grip and is close to a full-fledged breakdown. There’s no guarantee it will follow through. However, trading and investing are both about sizing up the probabilities, the only difference being the length of time involved.
Another distinctive feature of the XLU setup is in this weekly chart below. Frankly, it looks just like the daily chart I displayed above. As in, just as bad. It is tipping over and just broke the June low, while the percentage price oscillator (PPO) at bottom just entered negative momentum territory.
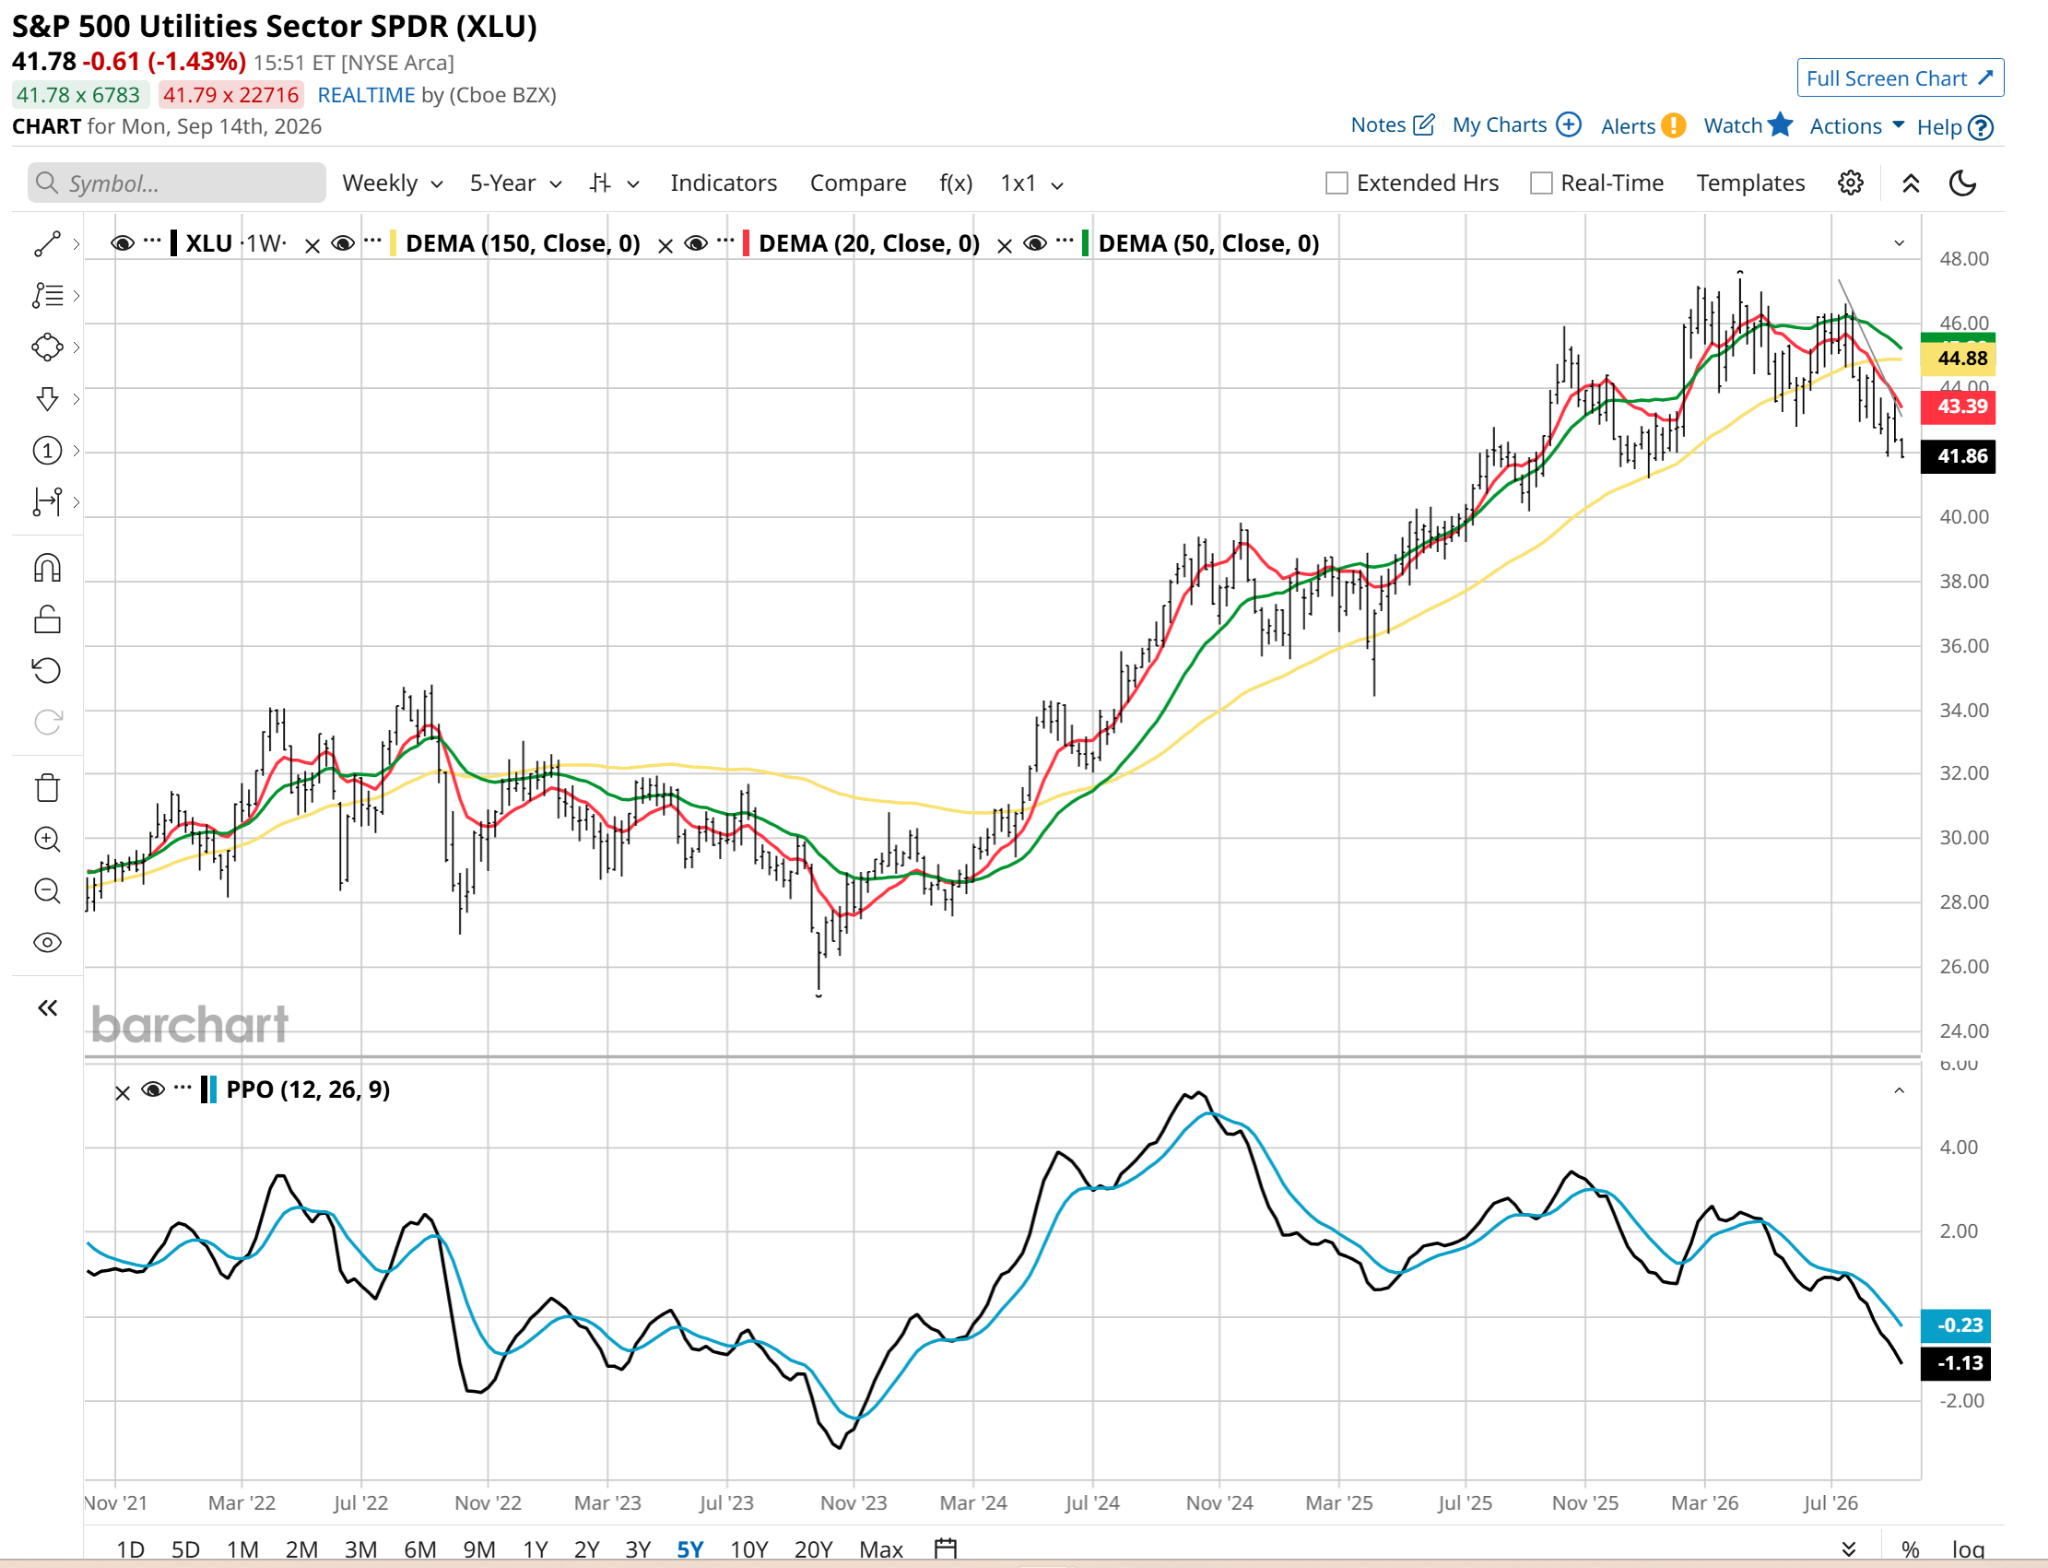
Why XLU’s Chart Looks So Risky
More each week, chart patterns like the ones I see in XLU are signaling that the market is quietly dropping the curtain on one of the favorite macro narratives of the past two years: the idea that utilities magically transformed into a high-growth proxy for artificial intelligence (AI).
For months, Wall Street touted power producers inside XLU, including several you see at the top of this ETF’s holdings.
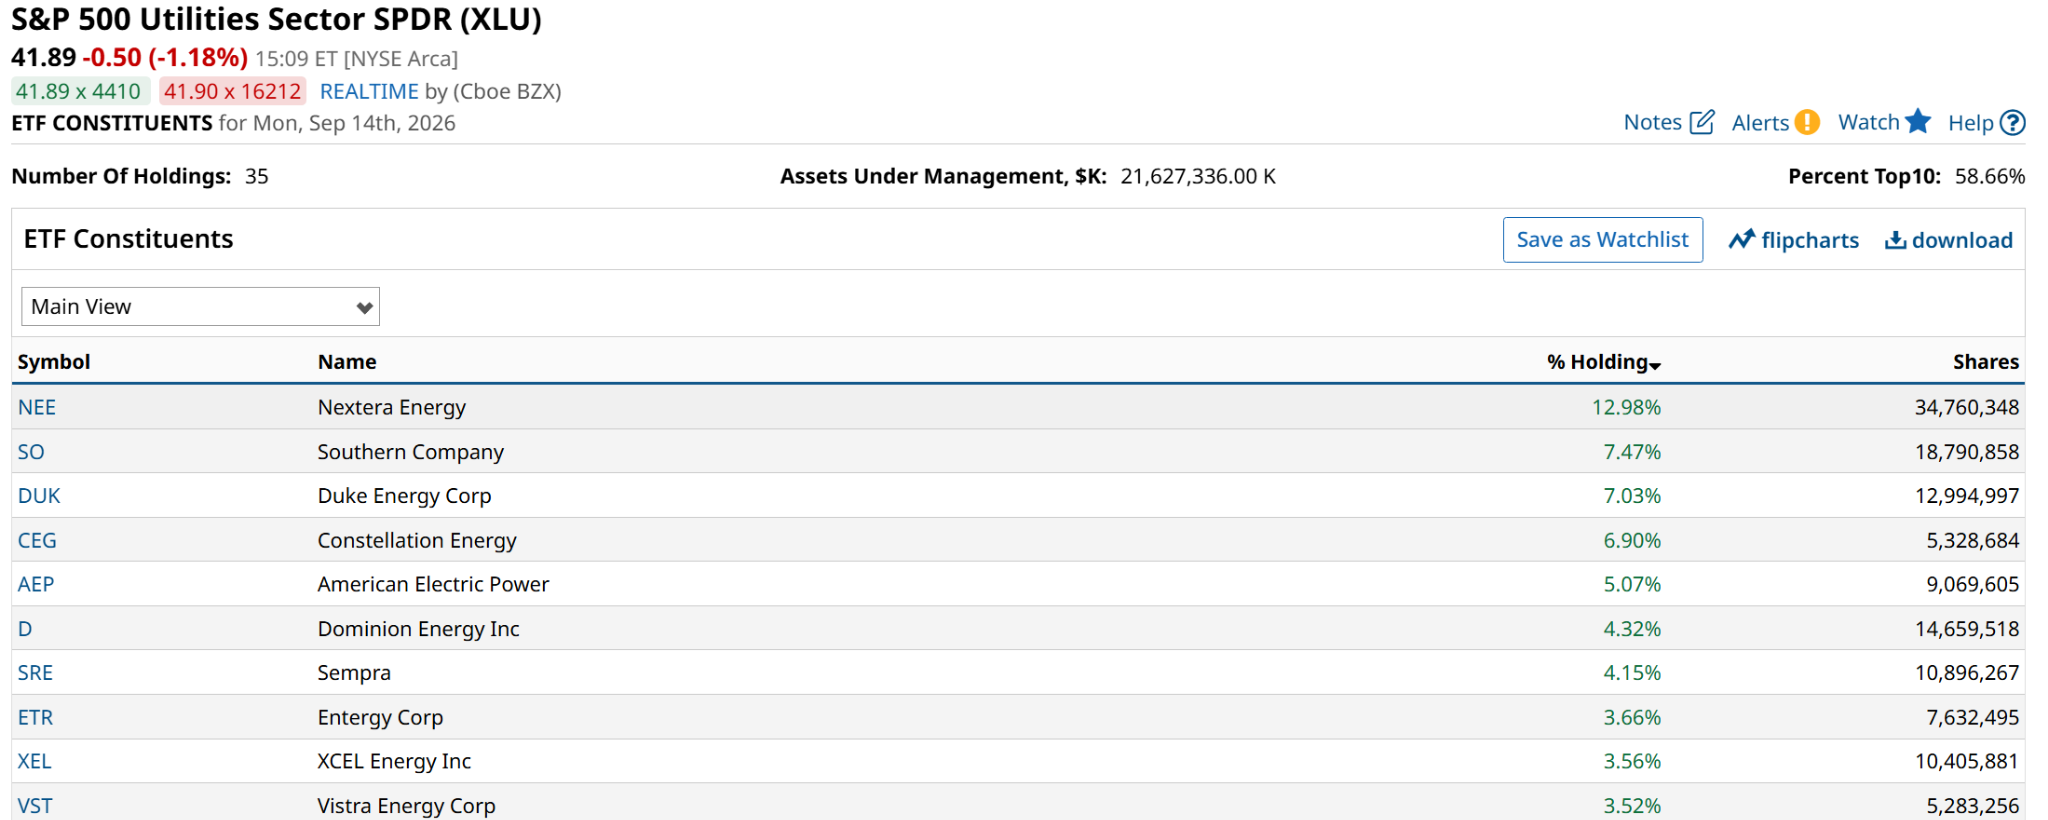
But as XLU enters an increasingly alarming downtrend, the sector is flashing an early warning signal that the entire AI trade is hitting a wall, while exposing the widely praised “broadening trade” as a complete nothingburger.
We always have to be careful about assigning superhero-like qualities to regular sectors. Such is the case with utilities.
I’ve highlighted three columns below in a table showing fundamentals for many of XLU’s top holdings. Note that these represent more than 60% of the total ETF. The price-earnings ratios are not bad compared to the S&P 500 Index ($SPX). However, this is the utilities sector, and high teens earnings multiples are nothing special.
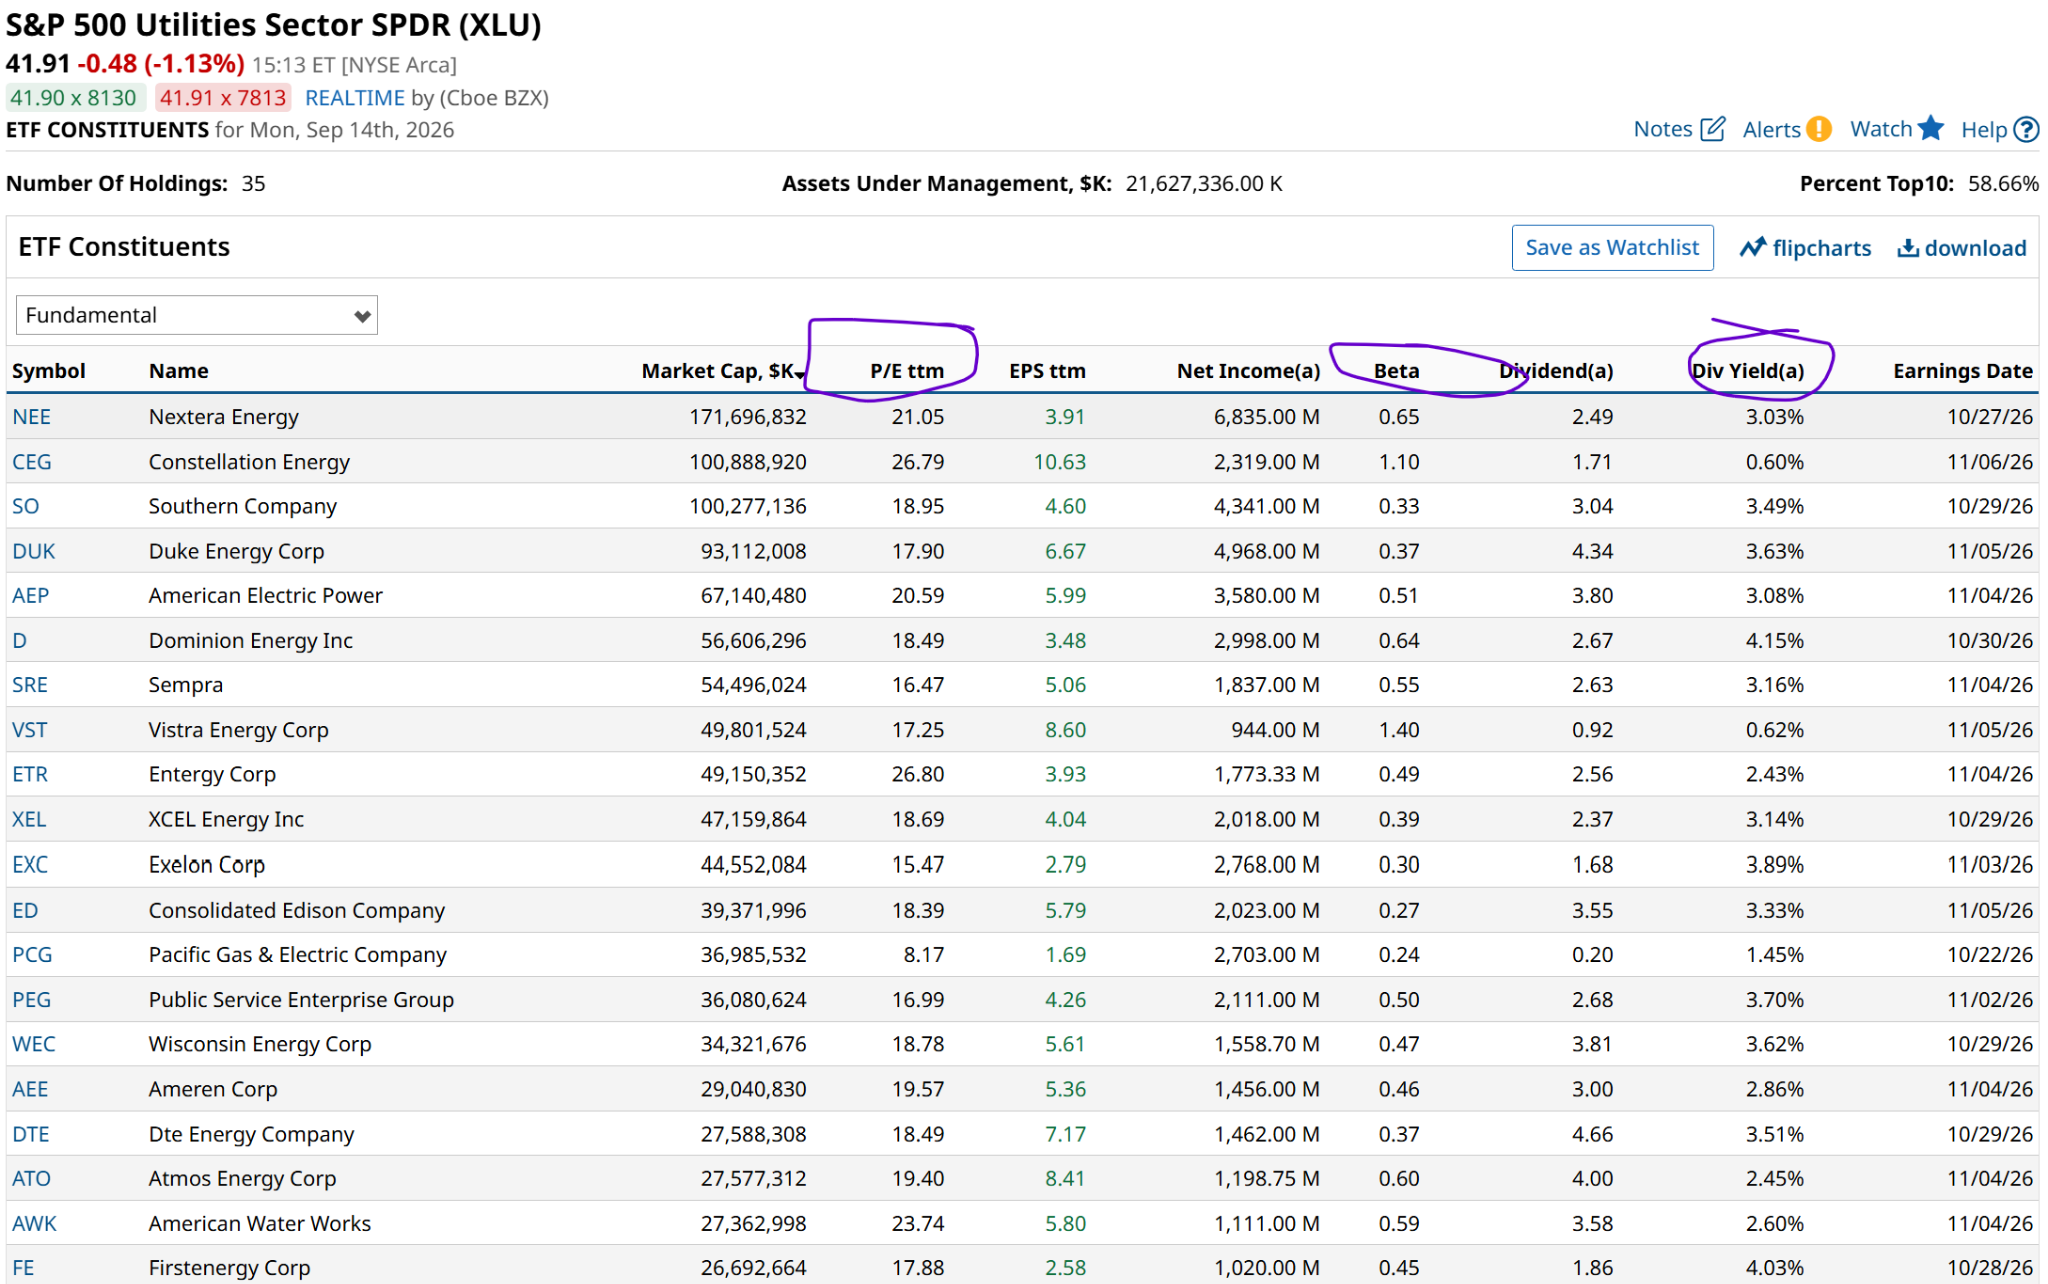
Dividend yield used to be the attraction here. But now, it is hard to sniff even a 4% payout. Just two of the 20 largest XLU stock holdings have a yield above that level.
And while those betas indicate a history of lower volatility, they are five-year trailing figures. More recently, the AI roller-coaster effect has impacted XLU as well. The last 10% drawdown here took just a few weeks.
The Triple Squeeze on Utilities
Investors who ran to this ETF for relative safety and dividend yield are finding themselves trapped in a triple squeeze of sorts. First, hyperscalers need vast amounts of power, but transforming that need into actual earnings for utilities takes years of site approvals, transmission builds, and regulatory hurdles.
Second, utilities are the most debt-dependent sector in the equity market. With 10-year and 30-year Treasury yields remaining elevated, XLU faces a double hit. Risk-free 5%-plus Treasury yields destroy the relative appeal of XLU’s dividend, while rising interest costs erode corporate net margins.
And third, modernizing aging power grids to handle high-density compute loads requires hundreds of billions in capital expenditures. Unlike tech firms, regulated utilities cannot simply raise prices overnight. Public utility commissions limit how fast and how much cost can be passed along to everyday consumers.
Financial commentary regularly preaches that as mega-cap tech cools, capital will healthily “broaden out” into value, small-cap stocks, and defensive sectors like utilities. XLU’s price action proves why that thesis is flawed.
That said, XLU might still fare better on a relative return basis during the next market mess. There’s something to be said for a sector’s reputation, especially in an era where so much capital is maneuvering based on programmed algorithms.
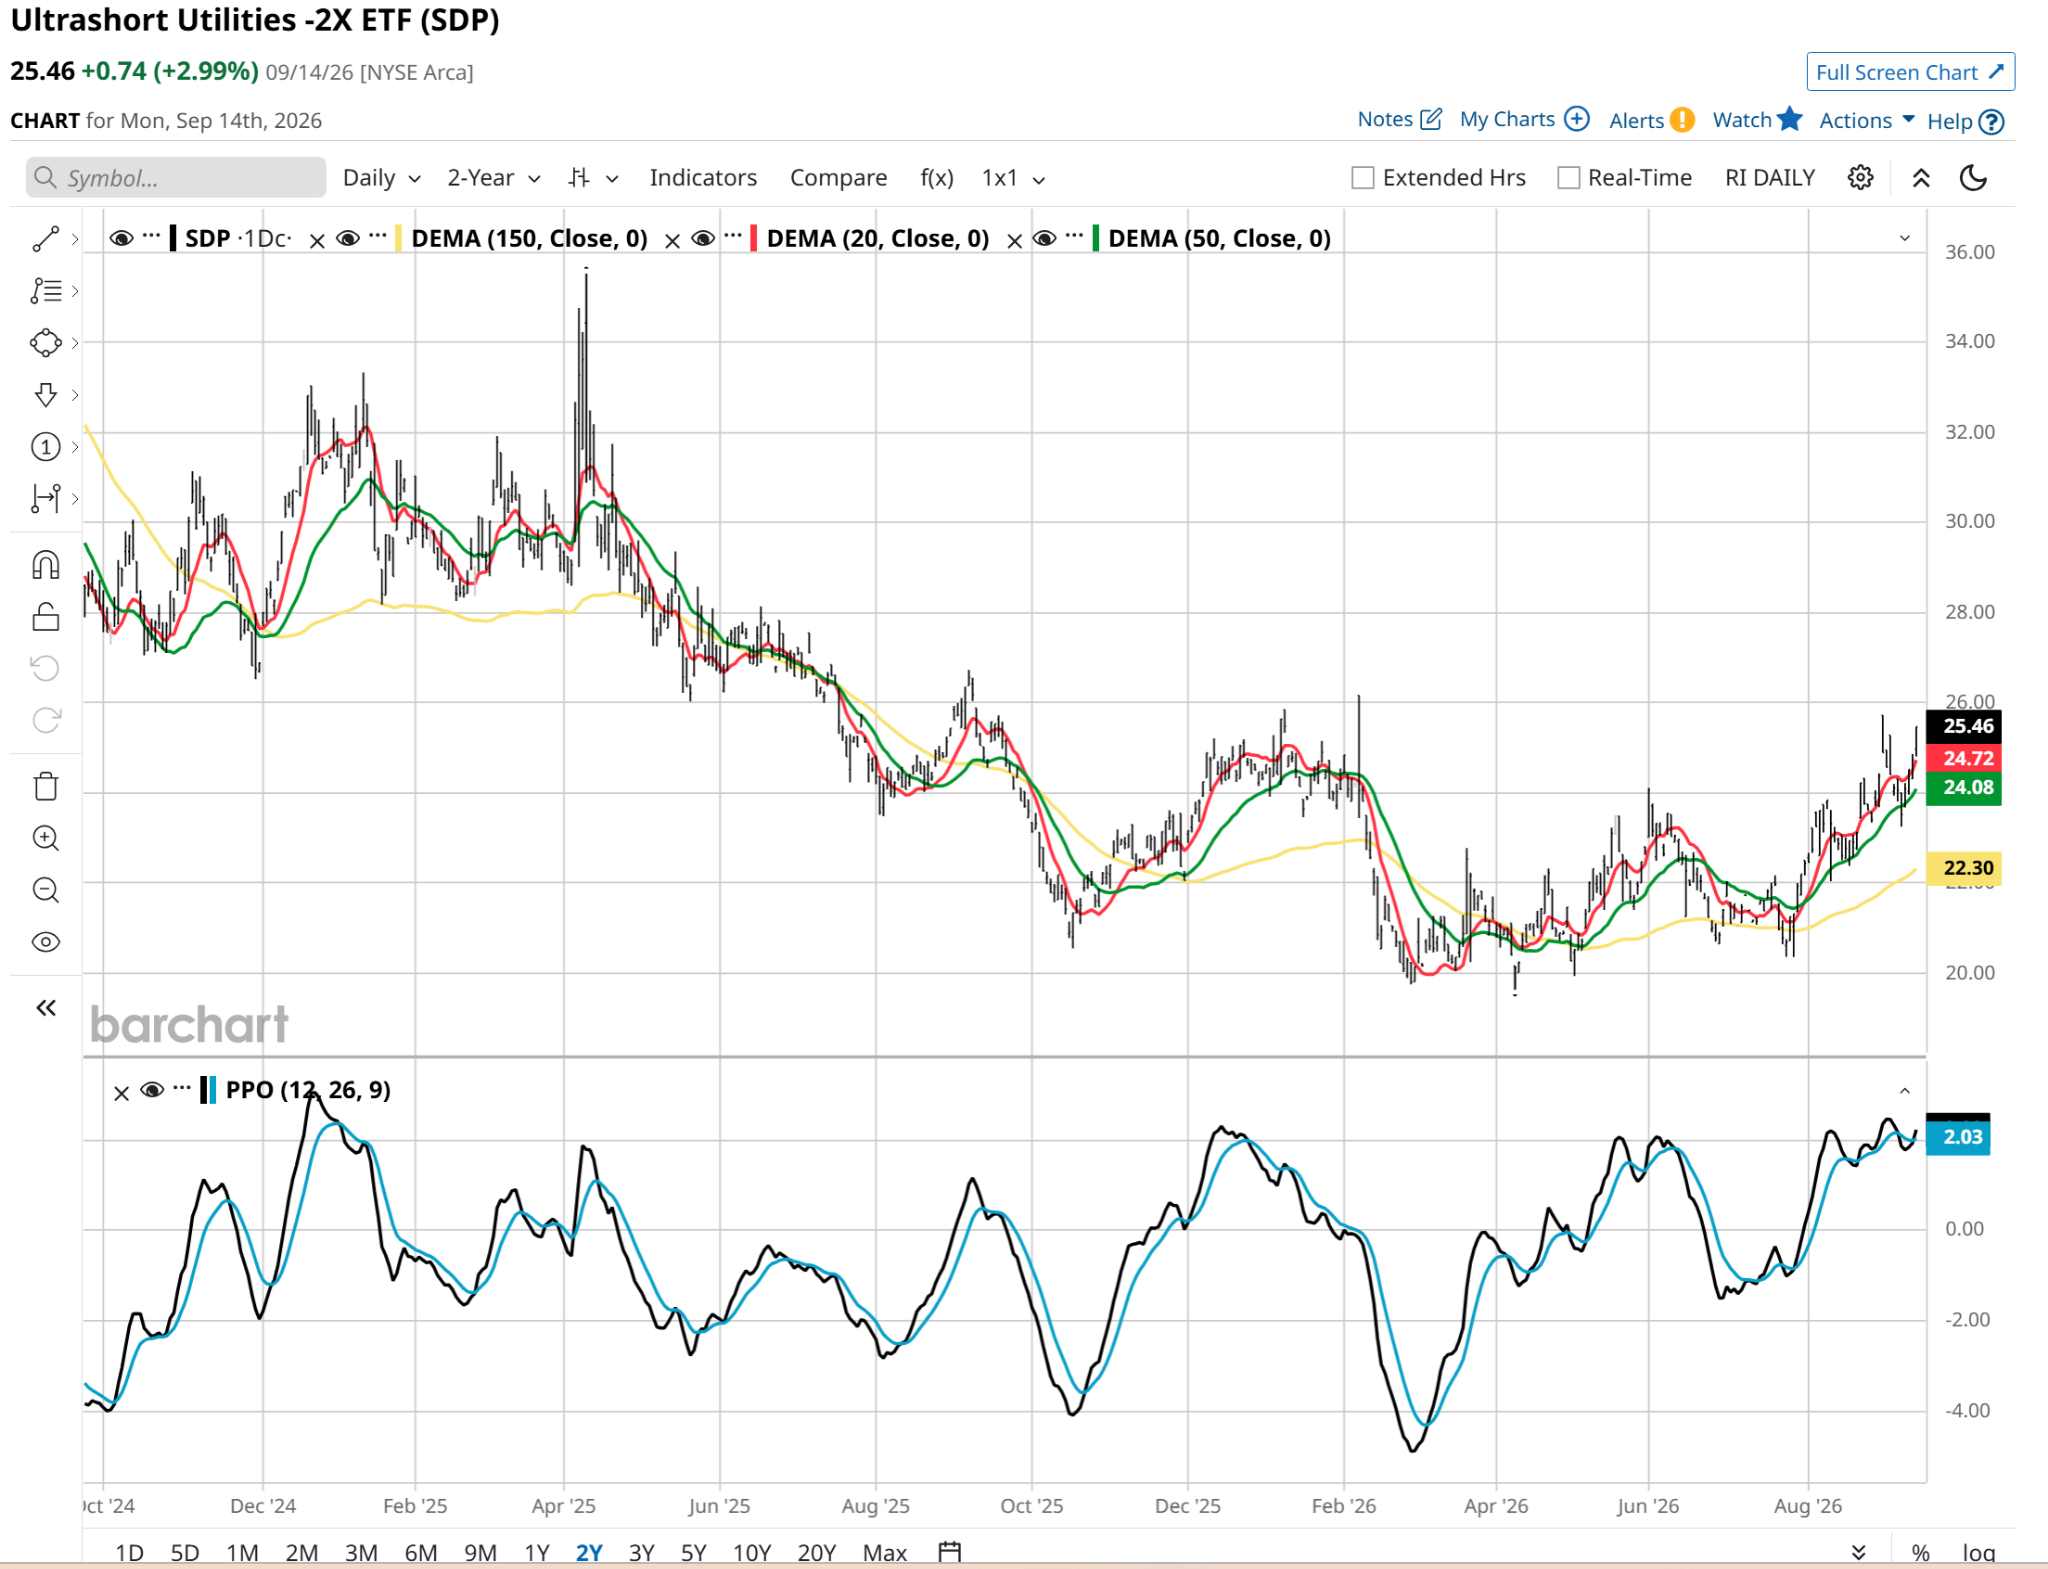
This last chart above is both an additional piece of technical evidence toward the XLU bear case, and my pointing out how to take further declines in utility stock prices and try to profit from them. This is SDP, one of a set of ProShares UltraShort ETFs that seek to deliver twice the daily return of a sector ETF, but in reverse. So for every 1% drop in XLU, SDP targets a 2% gain.
Some ETFs of this nature are not very popular, for the simple reason that we have not needed them. When the whole stock market is generally rising, inverse ETFs are a very low priority, scouted only by continuous hedgers like me.
As such, SDP sits with an under-the-radar asset level of $2.2 million. But that hasn’t prevented it from rallying 25% since late July. That’s yet another reminder that the best thing traders can do these days is to expand their field of vision. There are more ways to make money than being “long only” investors.
Rob Isbitts is a semi-retired CIO, former fiduciary investment advisor, and Barchart columnist. Check out his other work at ETFYourself.com (featuring the Fresh Charts weekly trading post), and ROAR.PiTrade.com, helping investors to better-manage their own portfolios.
On the date of publication, Rob Isbitts did not have (either directly or indirectly) positions in any of the securities mentioned in this article. All information and data in this article is solely for informational purposes. For more information please view the Barchart Disclosure Policy here.