


Is Delek US Holdings (DK) Overvalued On Current Earnings?
Delek US Holdings has seen its share price move sharply in recent years, which naturally raises a question for anyone looking at the stock today. Is the current valuation supported by the earnings power of the business, or has the price run ahead of what the income statement can reasonably back?
- Over the past 5 years, Delek US Holdings has delivered a total return of about 4.5x. This puts meaningful pressure on investors to test whether the earnings profile now matches the share price.
- The group’s ability to convert refining operations into consistent profits and cash flow can shape how much confidence investors place in its current earnings multiple.
- Your read on Delek US Holdings is one view; the desks covering it have another. See what analysts think Delek US Holdings's shares could be worth.
For investors, the debate is whether Delek US Holdings’ recent share price level is properly explained by the earnings it generates today.
If you want to test the same earnings question across a wider set of companies, you can compare Delek US Holdings with 35 high quality undervalued stocks.
Has Delek US Holdings Run Too Far on Earnings?
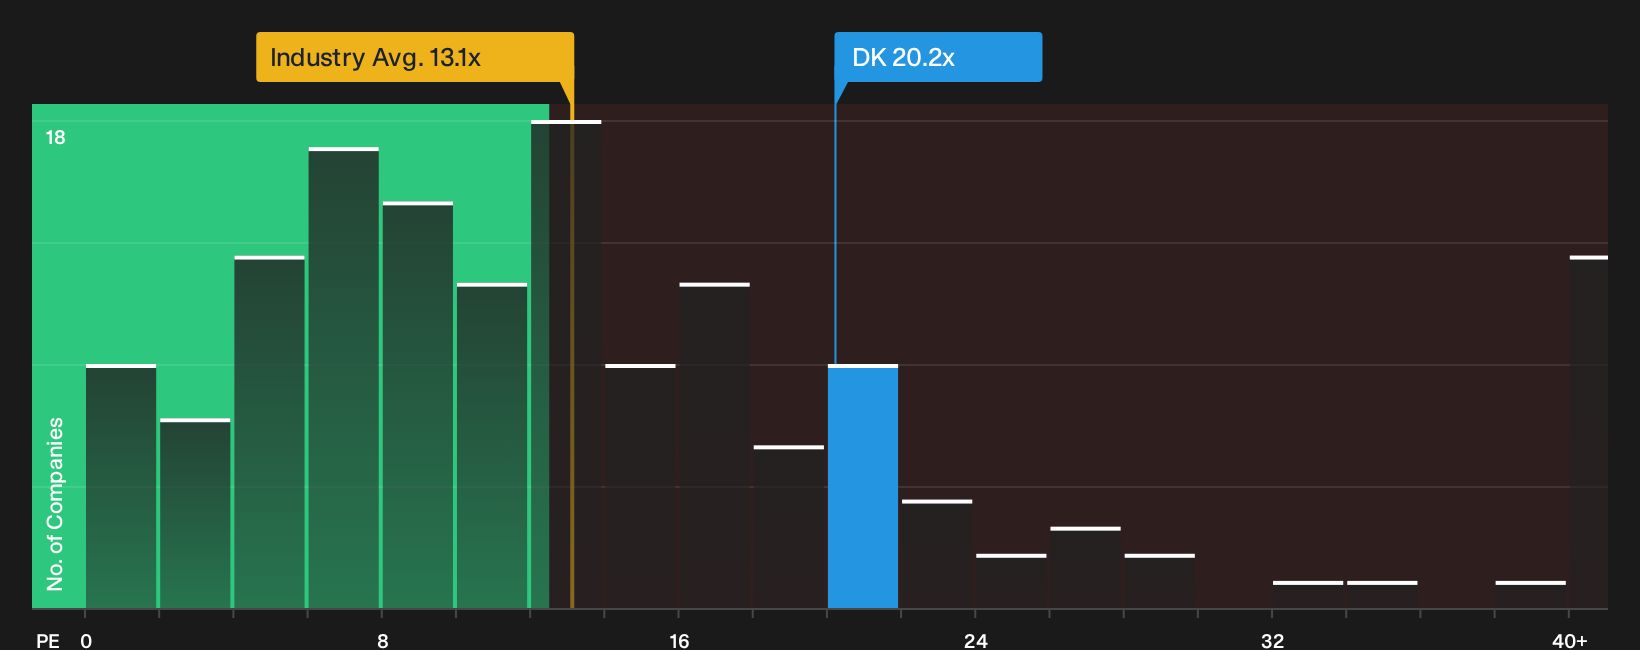
The P/E ratio is a useful shorthand for Delek US Holdings because it ties the current share price directly to the earnings that support it. At about 20.2x, the stock trades above the Oil and Gas sector average of roughly 13.1x, so you are paying a richer price per dollar of current profit than the typical refiner or energy peer.
Against a peer group on roughly 23.3x, Delek US Holdings sits a little lower, yet the tailored fair multiple implied by its own earnings profile and risk comes in well under where the shares change hands today. That gap suggests the market is pricing the business more expensively than this model would usually assign to a refiner with these fundamentals, so anyone considering the stock needs to decide whether its specific mix of refining exposure, balance sheet position and cash generation justifies paying that kind of premium. Explore the numbers behind Delek US Holdings's P/E valuation.
The Delek US Holdings Narrative: What Would Justify Today's Price?
Simply Wall St Narratives pick up where the valuation questions around Delek US Holdings leave off. They spell out which future paths for growth, margins and earnings would need to unfold for the stock to be worth materially more or less than today's price, and each one anchors a fair value to a specific mix of potential catalysts and risks so you can track over time which version of the story is actually reflected in the numbers on the Community page.
On Delek US Holdings, the community splits between a group that sees upside from execution and capital allocation and another that worries the valuation already bakes in too much.
Bull case: 10% undervalued
"Analyst consensus believes the Enterprise Optimization Plan can deliver $130 million to $170 million in annualized free cash flow improvements, but disciplined execution and a culture shift toward continuous operational efficiencies position Delek to consistently surpass even the top end of these expectations..."
Discover why this Narrative puts Delek US Holdings at 10% undervalued.
Bear case: 12% overvalued
"Despite recent operational improvements and EOP benefits, Delek continues to incur net losses and high capital expenditures, which, when combined with only moderate revenue growth and significant ongoing debt obligations, could strain free cash flow and reduce flexibility to make strategic investments in energy transition..."
Explore why this Narrative puts Delek US Holdings at 12% overvalued.
One more check for Delek US Holdings before you move on
Price and current earnings only tell part of the story, because broker models also sketch out where they expect Delek US Holdings to be a few years from now. That is a separate benchmark worth lining up next to today's multiples. Explore where analysts expect Delek US Holdings to be in a few years.
This article by Simply Wall St is general in nature. We provide commentary based on historical data and analyst forecasts only using an unbiased methodology and our articles are not intended to be financial advice. It does not constitute a recommendation to buy or sell any stock, and does not take account of your objectives, or your financial situation. We aim to bring you long-term focused analysis driven by fundamental data. Note that our analysis may not factor in the latest price-sensitive company announcements or qualitative material. Simply Wall St has no position in any stocks mentioned.
Have feedback on this article? Concerned about the content? Get in touch with us directly. Alternatively, email editorial-team@simplywallst.com