


Global Dividend Stocks To Consider In September 2026
As global markets grapple with inflation concerns fueled by rising oil prices and geopolitical tensions, investors are increasingly looking for stability in their portfolios. Dividend stocks can offer a reliable income stream during such volatile times, making them an attractive option for those seeking to balance risk and reward.
Top 10 Dividend Stocks Globally
| Name | Dividend Yield | Dividend Rating |
| Yeni Gimat Gayrimenkul Yatirim Ortakligi (IBSE:YGGYO) | 4.75% | ★★★★★★ |
| Telekom Austria (WBAG:TKA) | 4.14% | ★★★★★★ |
| SIGMAXYZ Holdings (TSE:6088) | 4.55% | ★★★★★★ |
| Sanwa Holdings (TSE:5929) | 3.83% | ★★★★★★ |
| NCD (TSE:4783) | 4.50% | ★★★★★★ |
| Kyoritsu Electric (TSE:6874) | 3.85% | ★★★★★★ |
| Kumagai GumiLtd (TSE:1861) | 3.88% | ★★★★★★ |
| Innotech (TSE:9880) | 3.92% | ★★★★★★ |
| Business Brain Showa-Ota (TSE:9658) | 4.25% | ★★★★★★ |
| 104 (TWSE:3130) | 7.05% | ★★★★★★ |
Click here to see the full list of 95 stocks from our Top Global Dividend Stocks screener.
We'll examine a selection from our screener results.
Rasa (TSE:3023)
Simply Wall St Dividend Rating: ★★★★★★
Overview: Rasa Corporation, along with its subsidiaries, engages in trading and supplying a variety of products across Japan, Singapore, China, Thailand, Asia, and other international markets with a market cap of ¥21.40 billion.
Operations: Rasa Corporation generates revenue from several segments, including ¥7.17 billion from Chemical Products, ¥387 million from Real Estate Rental, ¥2.98 billion from Environmental Equipment, ¥5.50 billion from Resources/Metal Materials, ¥2.81 billion from Plant/Equipment Construction, and ¥10.29 billion from Industrial Machinery/Construction Machinery.
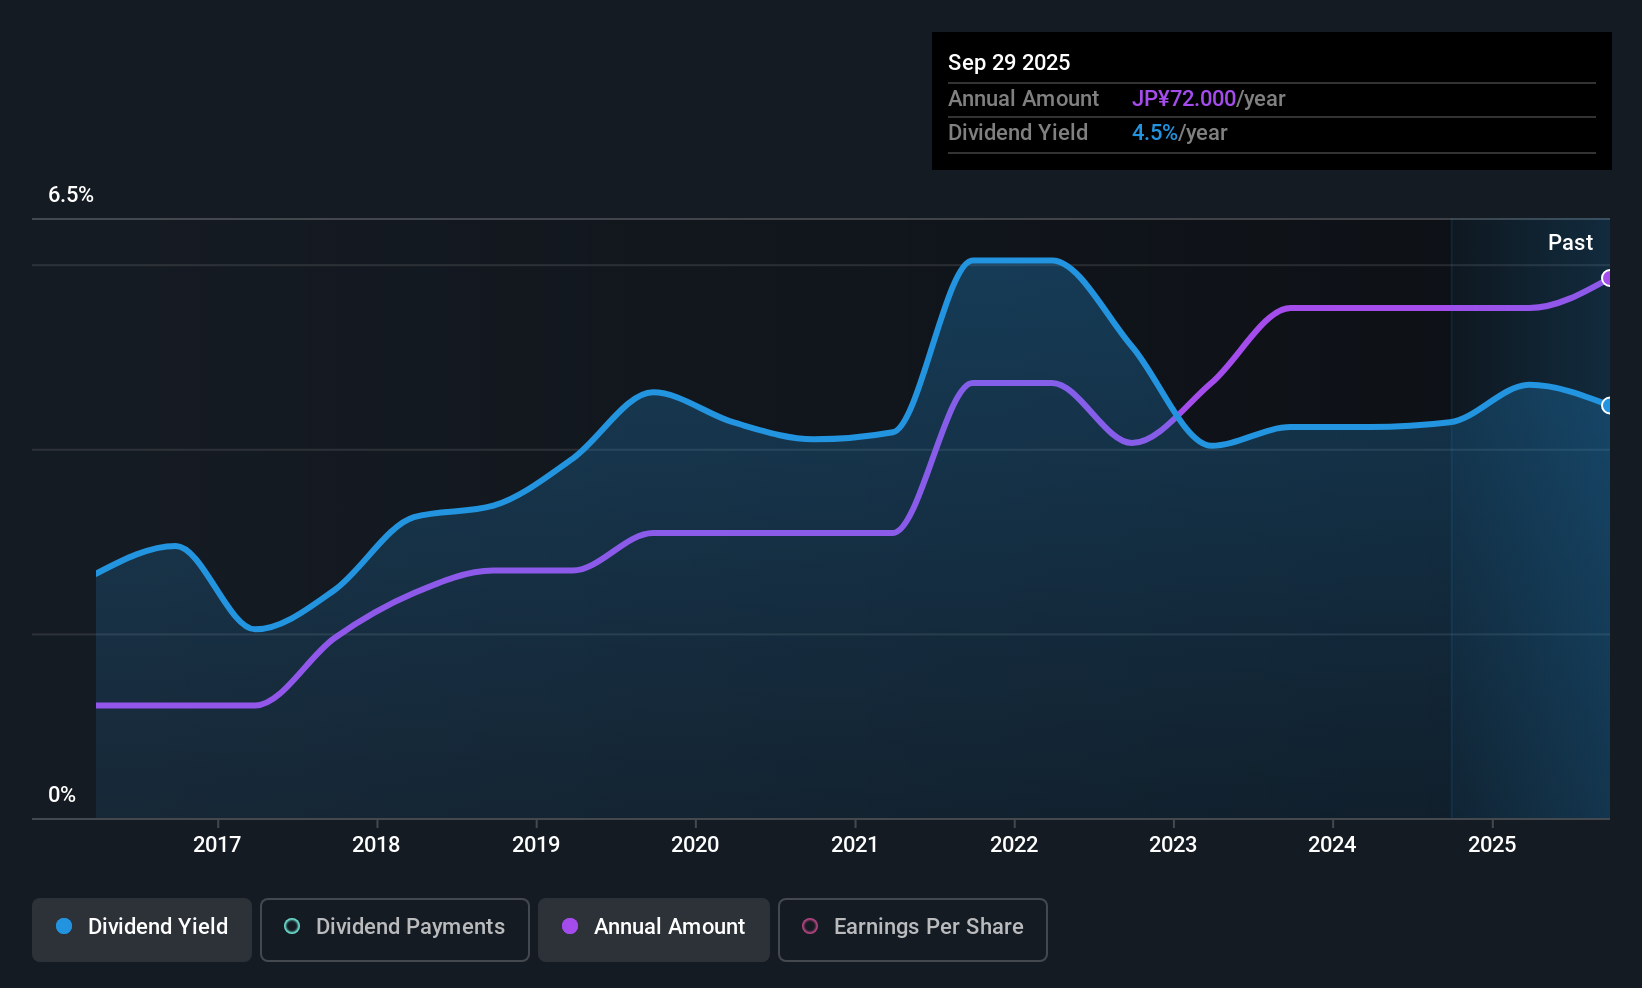
Dividend Yield: 3.9%
Rasa Corporation's dividend profile is compelling, with stable and growing dividend payments over the past decade. The dividends are well-covered by both earnings (payout ratio: 34.9%) and cash flows (cash payout ratio: 40.9%), suggesting sustainability. Trading at a significant discount to its estimated fair value, Rasa offers an attractive yield of 3.9%, placing it in the top tier of Japanese market payers. A recent ¥600 million share buyback program further enhances shareholder returns.
- Unlock comprehensive insights into our analysis of Rasa stock in this dividend report.
- The valuation report we've compiled suggests that Rasa's current price could be quite moderate.
Sakata INX (TSE:4633)
Simply Wall St Dividend Rating: ★★★★★★
Overview: Sakata INX Corporation manufactures and sells a range of printing inks and auxiliary agents across Japan, Asia, the Americas, Europe, and other international markets with a market cap of ¥124.41 billion.
Operations: Sakata INX Corporation's revenue segments include Printing Ink in Asia (¥59.77 billion), Europe (¥23.91 billion), and the Americas (¥107.73 billion), as well as Functionality Material (¥25.70 billion) and Printing Inks and Graphic Arts Materials in Japan (¥52.24 billion).
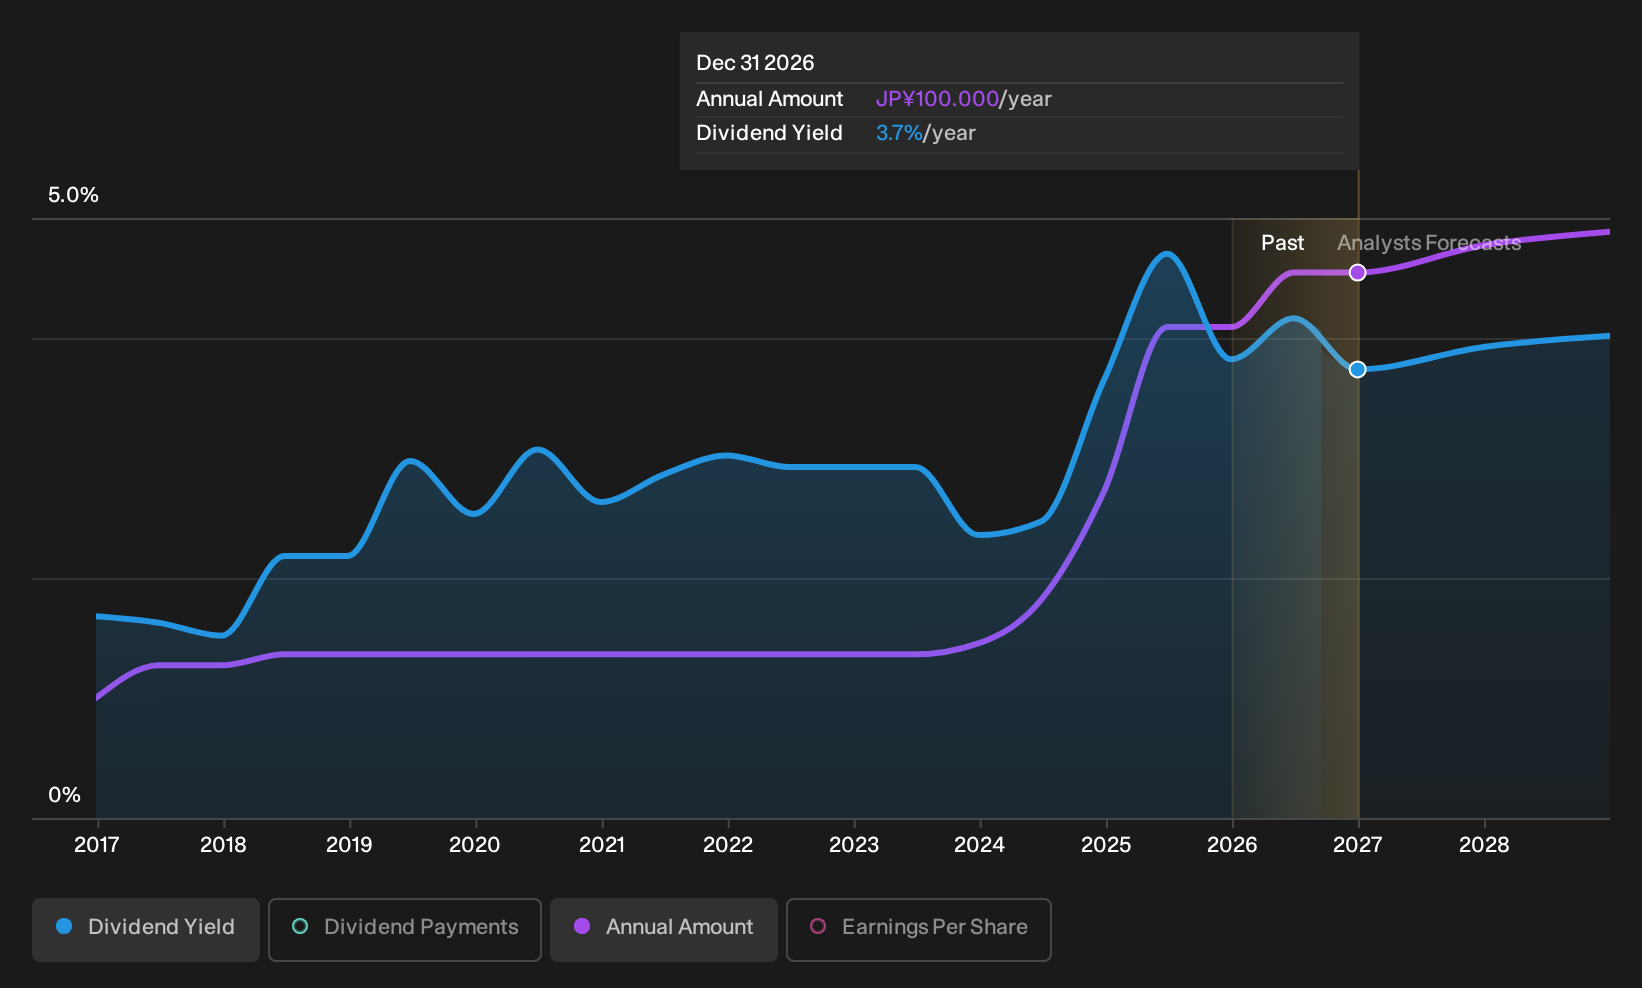
Dividend Yield: 3.9%
Sakata INX offers a robust dividend profile, with stable and growing dividends over the past decade, currently yielding 3.85%, placing it among Japan's top 25% dividend payers. The payout ratio of 40.7% and cash payout ratio of 49.1% indicate dividends are well-covered by earnings and cash flows, ensuring sustainability. Recent earnings guidance suggests increased net sales due to product expansion, supporting potential future dividend growth amid ongoing financial stability and strategic sales initiatives.
- Take a closer look at Sakata INX's potential here in our dividend report.
- Our valuation report unveils the possibility Sakata INX's shares may be trading at a discount.
Business Brain Showa-Ota (TSE:9658)
Simply Wall St Dividend Rating: ★★★★★★
Overview: Business Brain Showa-Ota Inc. operates in Japan, offering consulting, systems development, and business management services with a market cap of ¥34.96 billion.
Operations: Business Brain Showa-Ota Inc. generates revenue through three main segments: Consulting and System Development (¥23.37 billion), BPO & Managed Services (¥10.47 billion), and SES Co-creation Business (¥9.16 billion).
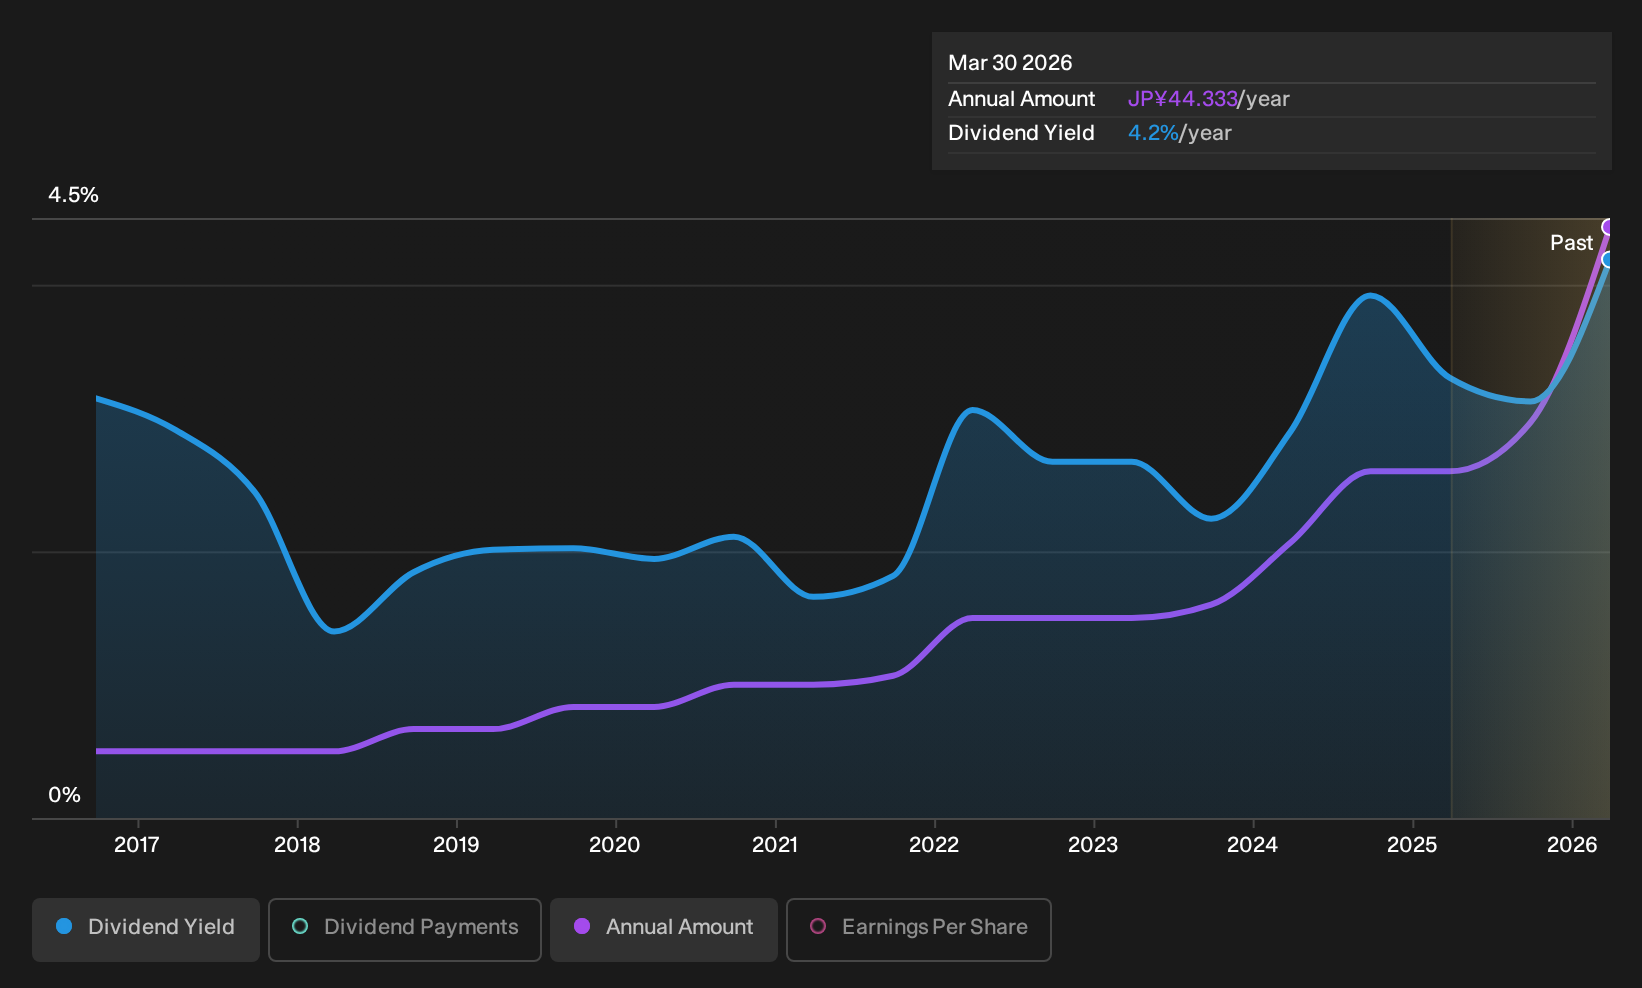
Dividend Yield: 4.3%
Business Brain Showa-Ota's dividend yield of 4.25% ranks it in the top 25% of Japanese dividend payers, supported by a stable and growing payout over the past decade. The company's dividends are well-covered, with a payout ratio of 55.1% and a cash payout ratio of 37.4%, ensuring sustainability despite recent earnings guidance revisions due to temporary operational challenges. However, solid order intake suggests potential profitability improvements, which may bolster future dividend prospects.
- Click here and access our complete dividend analysis report to understand the dynamics of Business Brain Showa-Ota.
- Insights from our recent valuation report point to the potential undervaluation of Business Brain Showa-Ota shares in the market.
Summing It All Up
- Explore the 95 names from our Top Global Dividend Stocks screener here.
- Are these companies part of your investment strategy? Use Simply Wall St to consolidate your holdings into a portfolio and gain insights with our comprehensive analysis tools.
- Streamline your investment strategy with Simply Wall St's app for free and benefit from extensive research on stocks across all corners of the world.
Searching for a Fresh Perspective?
- Explore high-performing small cap companies that haven't yet garnered significant analyst attention.
- Fuel your portfolio with companies showing strong growth potential, backed by optimistic outlooks both from analysts and management.
- Find companies with promising cash flow potential yet trading below their fair value.
This article by Simply Wall St is general in nature. We provide commentary based on historical data and analyst forecasts only using an unbiased methodology and our articles are not intended to be financial advice. It does not constitute a recommendation to buy or sell any stock, and does not take account of your objectives, or your financial situation. We aim to bring you long-term focused analysis driven by fundamental data. Note that our analysis may not factor in the latest price-sensitive company announcements or qualitative material. Simply Wall St has no position in any stocks mentioned.
Have feedback on this article? Concerned about the content? Get in touch with us directly. Alternatively, email editorial-team@simplywallst.com