


Is Angelalign Technology (SEHK:6699) Fully Priced As Earnings And Dividends Lift Sentiment?
Angelalign Technology (SEHK:6699) just wrapped a busy August 31, reporting half year 2026 results alongside an interim ordinary dividend and a special payout, putting shareholder returns firmly in focus.
Set against that strong half year update, Angelalign Technology’s share price has climbed 27.6% over the past 90 days and 44.8% year to date. The 1 year total shareholder return of 45.2% points to building momentum as investors reassess both growth prospects and perceived risk.
Scan how Angelalign Technology’s latest dividend and earnings news compares with other oral care and medical device players by reviewing a curated set of list of solid balance sheet and fundamentals (194 results) in the same space.
For Angelalign Technology, that surge in returns sits at the crossroads of stronger reported earnings and fresh dividend cheques on one side, and a sentiment reset on the other. Which of those is investors really paying for in the current valuation?
Price-to-Earnings of 46.8x: Is it justified?
On simple multiples, Angelalign Technology is carrying a rich tag. At HK$88.2 per share, the stock is trading on a P/E of 46.8x even though headline valuation work from Simply Wall St suggests the price is around 5.8% below an estimated intrinsic value of HK$93.61 based on future cash flows.
The P/E ratio compares what investors are paying today for each dollar of current earnings. For a medical equipment player with clear aligner products and dental clinics, that benchmark often reflects how long investors expect growth in profits to continue and how resilient those earnings might be through different industry cycles.
Against peers, that 46.8x P/E is steep. It sits well above the Hong Kong Medical Equipment group on 15.9x and also above the peer set average of 24.1x. The gap to the estimated fair P/E of 18.9x is even wider. This points to a market that is pricing in a strong earnings trajectory and sustained high quality profits, and leaves less room for disappointment if growth or margins come in below expectations.
Explore the SWS fair ratio for Angelalign Technology.
Result: Price-to-Earnings of 46.8x (OVERVALUED)
Still, any stumble in Angelalign Technology’s earnings delivery, or a shift in sentiment toward higher growth expectations, could quickly pressure that premium P/E tag.
Find out about the key risks to this Angelalign Technology narrative.
Another View on Angelalign Technology’s Value
There is a twist when switching from the P/E lens to the SWS DCF model. On that cash flow based approach, Angelalign Technology at HK$88.2 screens as around 5.8% below an estimated fair value of HK$93.61. This frames the stock as modestly undervalued rather than stretched.
The two signals pull in different directions. A rich 46.8x earnings multiple points to valuation risk if sentiment cools. In contrast, a small DCF discount hints at limited downside if forecasts hold. Which yardstick do you trust more when real money is on the line?
Look into how the SWS DCF model arrives at its fair value.
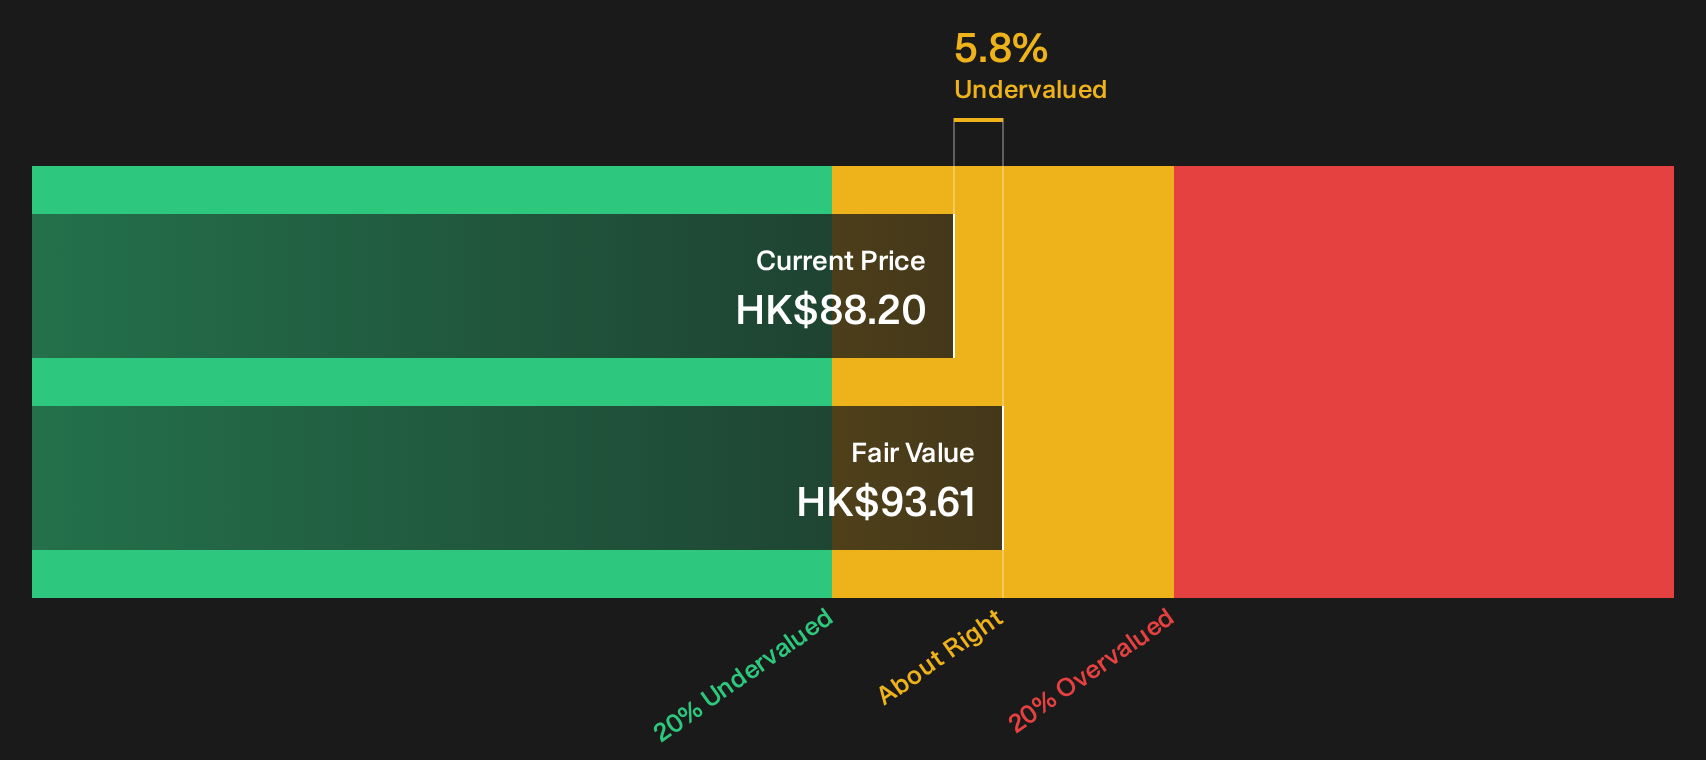
Simply Wall St performs a discounted cash flow (DCF) on every stock in the world every day (check out Angelalign Technology for example). We show the entire calculation in full. You can track the result in your watchlist or portfolio and be alerted when this changes, or use our stock screener to discover 189 high quality undervalued stocks. If you save a screener we even alert you when new companies match - so you never miss a potential opportunity.
Next Steps
Mixed signals on Angelalign Technology’s valuation and sentiment do not have to leave you on the fence. Move quickly and test the thesis against the data that matters to you, including the balance of 4 key rewards and 2 important warning signs
Looking for more Angelalign Technology investment ideas?
If you like the Angelalign Technology story but do not want all your money riding on one stock, broaden your opportunity set with a few targeted screens.
- Target potential mispricings by scanning a focused set of 189 high quality undervalued stocks that combine quality fundamentals with appealing valuations.
- Prioritise resilience in tougher markets by assessing 103 resilient stocks with low risk scores that pair steadier risk profiles with healthier financial footing.
- Hunt for future leaders early by reviewing 616 high quality undiscovered gems that show strong underlying metrics before they draw wider attention.
This article by Simply Wall St is general in nature. We provide commentary based on historical data and analyst forecasts only using an unbiased methodology and our articles are not intended to be financial advice. It does not constitute a recommendation to buy or sell any stock, and does not take account of your objectives, or your financial situation. We aim to bring you long-term focused analysis driven by fundamental data. Note that our analysis may not factor in the latest price-sensitive company announcements or qualitative material. Simply Wall St has no position in any stocks mentioned.
Have feedback on this article? Concerned about the content? Get in touch with us directly. Alternatively, email editorial-team@simplywallst.com