


Walsh Pure Grain Technicals / Daily News – Pure Hedge Division
Tim Healy 9/14/2026
If you would like to receive more information on the commodity markets or would like to open an account, please give me a call or click the link below.
Dec '26 Corn 533’2 last traded
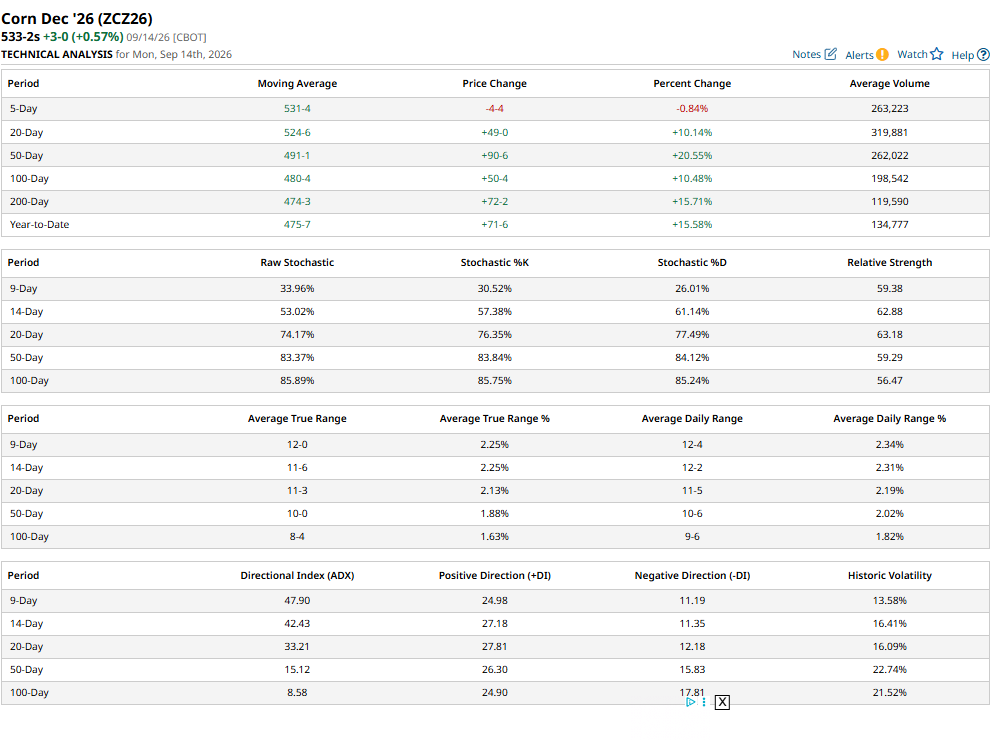
Moving Averages:
5-day: 531-4
20-day: 524-6
50-day: 491-1
100-day: 480-4
200-day: 474-3
The important feature is the very clean bullish MA structure:
Price > 5-day > 20-day > 50-day > 100-day > 200-day That is characteristic of a strong established uptrend. The 20-day MA is about 8’4 cents below price, while the 50-day is about 42 cents below. The widening spread between the 20-day and 50-day moving averages confirms accelerating trend strength and suggests the longer-term uptrend remains firmly intact.
The short-term stochastic has improved: 9-day %K: 30.52, 9-day %D: 26.01
So %K is back above %D, suggesting short-term momentum is turning higher after the recent pullback. However, the longer stochastics are still elevated:
20-day: 76.35 / 77.49
50-day: 83.84 / 84.12
100-day: 85.75 / 85.24
Corn has the best combination of price trend + momentum.
The recent decline in the 5-day MA doesn't look like a major trend break. It looks more like a short-term consolidation within a strong uptrend.
Bullish unless Dec corn loses the 20-day MA around 524-6.
Nov '26 Soybeans 1304’2 last traded. Trend remains bullish, but momentum is deteriorating.
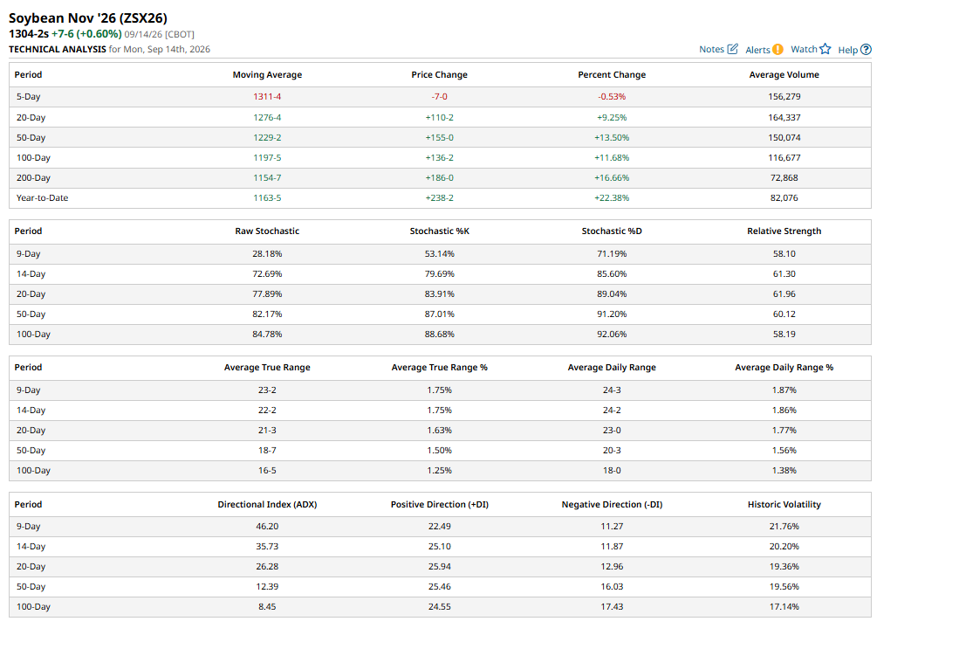
Moving averages:
5-day: 1311-4
20-day: 1276-4
50-day: 1229-2
100-day: 1197-5
200-day: 1154-7
This is a bullish MA configuration.
Price is currently below the 5-day MA, but remains substantially above every longer-term MA. That tells me the soybean market is experiencing a short-term correction rather than a confirmed trend reversal. The bigger warning is stochastic momentum. The stochastic readings are considerably more bearish than corn:
9-day
%K = 53.14
%D = 71.19
14-day
%K = 79.69
%D = 85.60
20-day
%K = 83.91
%D = 89.04
50-day
%K = 87.01
%D = 91.20
The repeated pattern of % K below % D indicates momentum has turned downward.
And the 50- and 100-day stochastic readings remain very high, meaning soybeans have been in a prolonged overbought condition.
Bullish trend + bearish short-term momentum and I'd be more cautious chasing Nov beans higher here. The 20-day MA at 1276’4 becomes the important trend test. A move back toward that area would represent a much more meaningful correction.
Dec '26 Wheat Last Price: 722-0
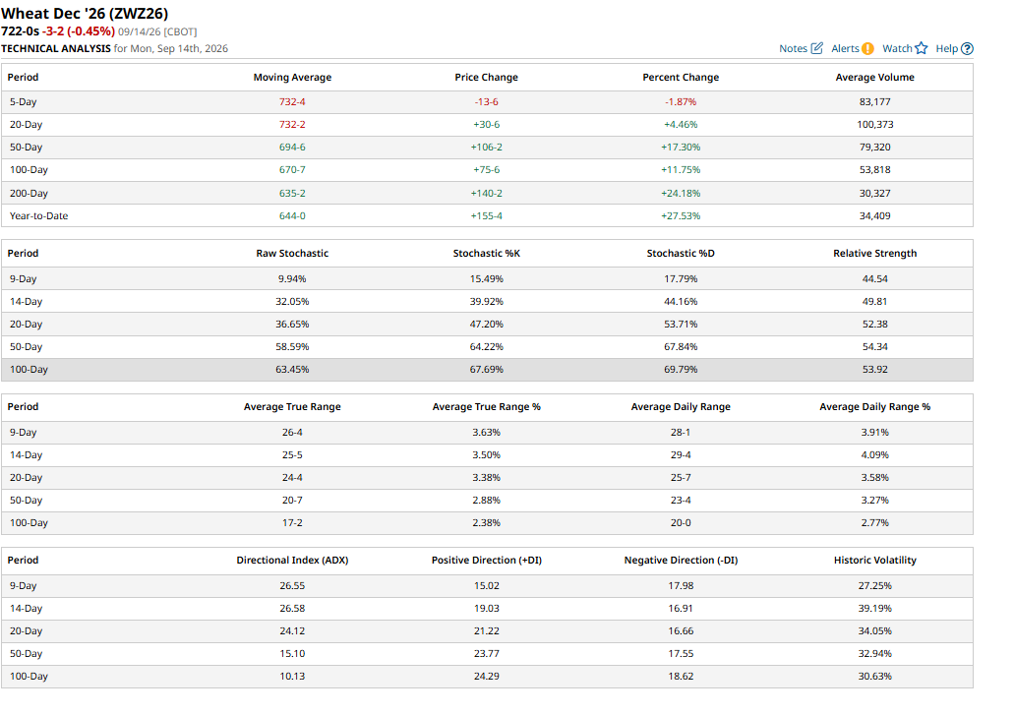
Moving averages:
5-day: 732-4
20-day: 732-2
50-day: 694-6
100-day: 670-7
200-day: 635-2
Wheat has a very different setup. The longer-term trend remains bullish:
722 > 694 > 670 > 635 But price is now below both the 5-day and 20-day averages.
That indicates a short-term correction inside a longer-term uptrend. Stochastics is the biggest signal
9-day Raw stochastic: 9.94
%K: 15.49
%D: 17.79
That's extremely oversold.
The 14-day is also weak:
%K: 39.92
%D: 44.16
And 20-day:
%K: 47.20
%D: 53.71
Wheat has experienced a significant momentum washout, with all major stochastic timeframes showing %K below %D.
Wheat has the best oversold/rebound setup, but not the strongest immediate trend.
A move back above 732-2/732-4 would be particularly important because that would put wheat back above both its 5- and 20-day averages.
Corn has the strongest technical trend, price above all major MAs, and RSI/Relative Strength readings range from approximately 59-63, with short term stochastic turning upward.
Corn currently has the strongest combination of trend and momentum, while soybeans maintain the strongest long-term bullish moving-average structure. I also think they have the greatest overbought risk and have the largest separation from their long-term averages.
The stochastic configuration is warning:
%K < %D across virtually every meaningful timeframe. That suggests the market may need to correct/consolidate before another leg higher.
Wheat has the strongest recovery potential if momentum begins to turn higher.
It's much closer to oversold territory, particularly on the 9-day stochastic.
If wheat can reclaim the 732 area, you could see a meaningful stochastic-driven bounce.

Tim Healy
Broker
Pure Hedge Division
Direct: 1 312 957 4731
WALSH TRADING INC.
311 S. Wacker Suite 540
Chicago, Illinois 60606
Walsh Trading, Inc. is registered as a Guaranteed Introducing Broker with the Commodity Futures Trading Commission and an NFA Member.
Futures and options trading involve substantial risk and is not suitable for all investors. Therefore, individuals should carefully consider their financial condition in deciding whether to trade. Option traders should be aware that the exercise of a long option will result in a futures position. The valuation of futures and options may fluctuate, and as a result, clients may lose more than their original investment. The information contained on this site is the opinion of the writer or was obtained from sources cited within the commentary. The impact on market prices due to seasonal or market cycles and current news events may already be reflected in market prices. PAST PERFORMANCE IS NOT NECESSARILY INDICATIVE OF FUTURE RESULTS.
All information, communications, publications, and reports, including this specific material, used and distributed by Walsh Trading, Inc. (“WTI”) shall be construed as a solicitation for entering into a derivatives transaction. WTI does not distribute research reports, employ research analysts, or maintain a research department as defined in CFTC Regulation 1.71.