


Ohara (TSE:5218) Stock Price Lags Even As Profit Growth Accelerates
Ohara came into this print with a richer P/E multiple than the broader Japanese electronics sector and a stock that had slipped over the past week and month. The headline this quarter is profit power. Net income reached ¥696m on revenue of ¥9,099m, lifting basic earnings per share to ¥29.33 and reinforcing trailing earnings growth over the past year. For a business already priced above the industry average, this level of earnings is what holders wanted to see, even if the share price reaction has been cautious so far.
Is Ohara a quality stock priced for more earnings strength, or is the current P/E simply stretching what the recent profit run can justify? Map that gap between headline results, one off gains and underlying cash expectations in the valuation analysis for Ohara
Q3 2026 Earnings Summary
- Revenue (Q3 2026 vs. Q3 2025): ¥9,099m vs. ¥7,266m (up about 25%)
- Net Income (Q3 2026 vs. Q3 2025): ¥696m vs. ¥374m (up about 86%)
- Basic EPS (Q3 2026 vs. Q3 2025): ¥29.33 vs. ¥15.35 (up about 91%)
- Trailing 12-Month Net Profit Margin (Q3 2026 vs. Q3 2025): 5.5% vs. 5.4% (slight margin improvement on a trailing basis)
Tired of scrolling through dense earnings tables and fragmented updates on Ohara? See the full financial picture in clean, visual charts that highlight valuation in our company report for Ohara.
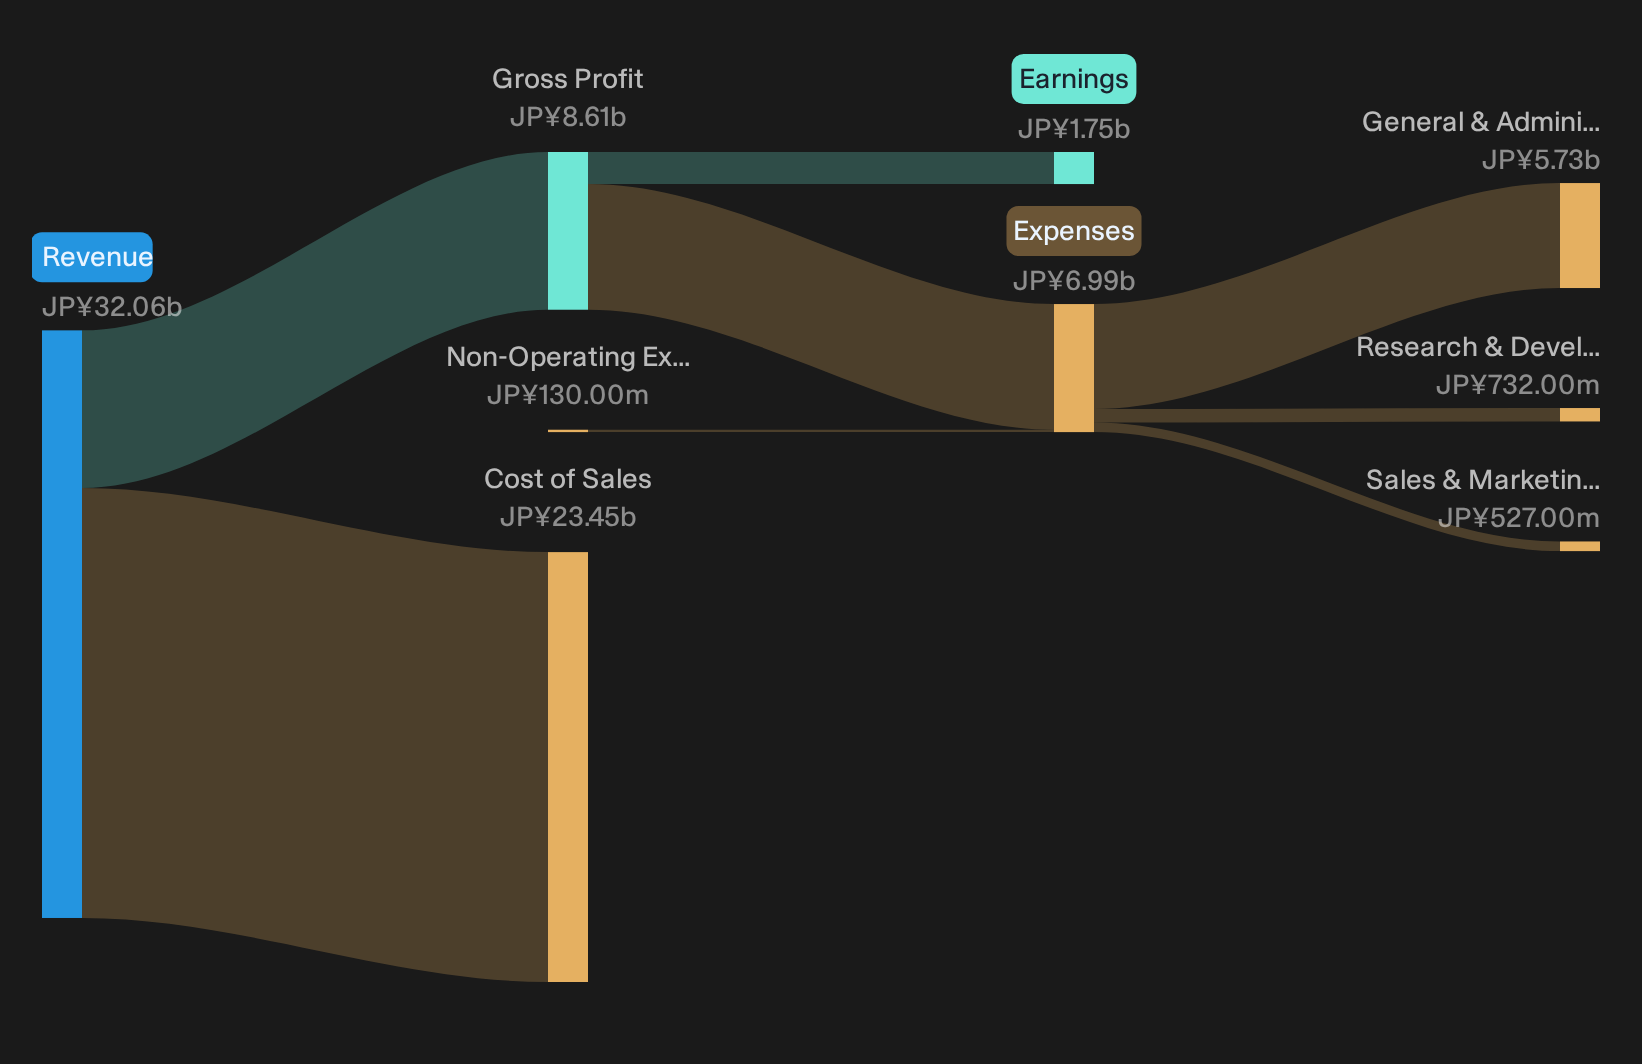
Ohara earnings and the high-tech glass upside
For anyone leaning positive on Ohara as a quiet way to play high-tech hardware, this quarter gives some backing. Revenue and net income both moved higher year on year, and earnings per share almost doubled. Profit margin on a trailing basis edged up, which hints that higher sales are not being swallowed by costs. Recent 90 day share performance is in positive territory, so the market has not rejected this earnings path outright, even if the last month has been soft.
Testing the downside risks in Ohara’s story
The cautious view focuses on cyclicality and execution risk, and there is some support for that. While operating results look stronger, the share price has slipped about 4% over both 7 and 30 days into the 11 September 2026 close. That pattern suggests investors are not treating the latest profit jump as a clear new trend yet. For a materials supplier exposed to electronics cycles, that hesitancy keeps the risk of bumpier quarters in focus even after a solid set of numbers.
After a share price that has swung more than the broader JP market and earnings shaped by one off items, it is worth asking whether these are isolated quirks or signs of deeper fragility. Review the full risk scoring and see what other pressure points analysts have already flagged in the risk analysis for Ohara which shows 2 important warning signs.Level Up Your Next Move On Ohara
After a quarter where Ohara pushed profits higher while the share price stayed cautious, it makes sense to track how sentiment and valuation shift from here. Register for free with Simply Wall St and add it to a Watchlist to watch price against fair value and be ready when the setup looks right. Once you own it, use your Portfolio Command Center to cut through noise and get only the updates that matter for your holdings. Then tap into the collective view through the Community so you can spot potential catalysts and risks early and stay ahead of the market.
Seeking Alternatives Beyond Ohara?
Fresh ideas often move first. Some trends start quietly, then breakout before most investors notice. Scan curated shortlists while they are still under the radar for now and get in early.
- Spot potential breakout payers throwing off solid cash and generous yields by reviewing the curated 19 dividend fortresses before others chase the income momentum.
- Zero in on sturdier balance sheets and cleaner fundamentals using the hand picked list of solid balance sheet and fundamentals stocks (19 results) before quality starts getting priced into every move.
- Track early momentum where resilience meets lower volatility by scanning the carefully filtered 10 resilient stocks with low risk scores while pricing dislocations still look fresh.
This article by Simply Wall St is general in nature. We provide commentary based on historical data and analyst forecasts only using an unbiased methodology and our articles are not intended to be financial advice. It does not constitute a recommendation to buy or sell any stock, and does not take account of your objectives, or your financial situation. We aim to bring you long-term focused analysis driven by fundamental data. Note that our analysis may not factor in the latest price-sensitive company announcements or qualitative material. Simply Wall St has no position in any stocks mentioned.
Have feedback on this article? Concerned about the content? Get in touch with us directly. Alternatively, email editorial-team@simplywallst.com