


Radian Group (RDN) Ties Into Lender Price As Questions Linger Over Its Cheap Valuation
Radian Group (RDN) is back on investor radar after subsidiary Radian Guaranty plugged its mortgage insurance quoting tools into Lender Price, an AI-driven pricing engine widely used across the mortgage industry.
Radian Group’s recent tech tie up comes after a mixed stretch for the stock, with the 90 day share price return up 3.13% but the 1 month move down 4.40%. The 5 year total shareholder return of 91.08% points to much stronger long run momentum.
Scan beyond Radian Group’s headline deal and compare it with a curated set of financials-focused plays by using the list of solid balance sheet and fundamentals (23 results).
Radian Group now trades at a recent price that trails both analyst targets and some intrinsic value estimates. Is that gap a genuine margin of safety, or a warning that expectations run too hot?
Price-to-Earnings of 8.4x: Is it justified?
On simple headline numbers, Radian Group looks cheap, with the stock trading on a P/E of 8.4x while the wider US Diversified Financials group sits at 17.6x and direct peers average 9.1x.
The P/E ratio compares what investors are paying for each dollar of Radian Group’s earnings. For a mortgage insurer generating $1.65b in revenue and $559.3m in net income, this measure helps you see how the market is pricing that profit stream relative to similar financial businesses.
Here, the market is assigning Radian Group a lower earnings multiple than both the sector and peer averages. Revenue is forecast to rise 15.9% per year and earnings are expected to grow 11.79% annually. The estimated “fair” P/E of 12.6x from the SWS fair ratio analysis sits well above the current 8.4x level. This points to a valuation gap that could narrow if the market shifts closer to that benchmark.
Against the industry’s 17.6x average P/E, Radian Group’s 8.4x looks materially compressed. Even relative to the 9.1x peer average, the discount is clear. With the fair P/E ratio estimated at 12.6x, the current market pricing leaves a sizeable buffer compared with the level the model suggests investors could eventually gravitate toward.
Explore the SWS fair ratio for Radian Group
Result: Price-to-Earnings of 8.4x (UNDERVALUED)
Still, Radian Group depends heavily on US mortgage activity. A weaker housing market or tighter credit standards could quickly challenge current earnings power and sentiment.
Find out about the key risks to this Radian Group narrative.
Another View on Radian Group’s Value
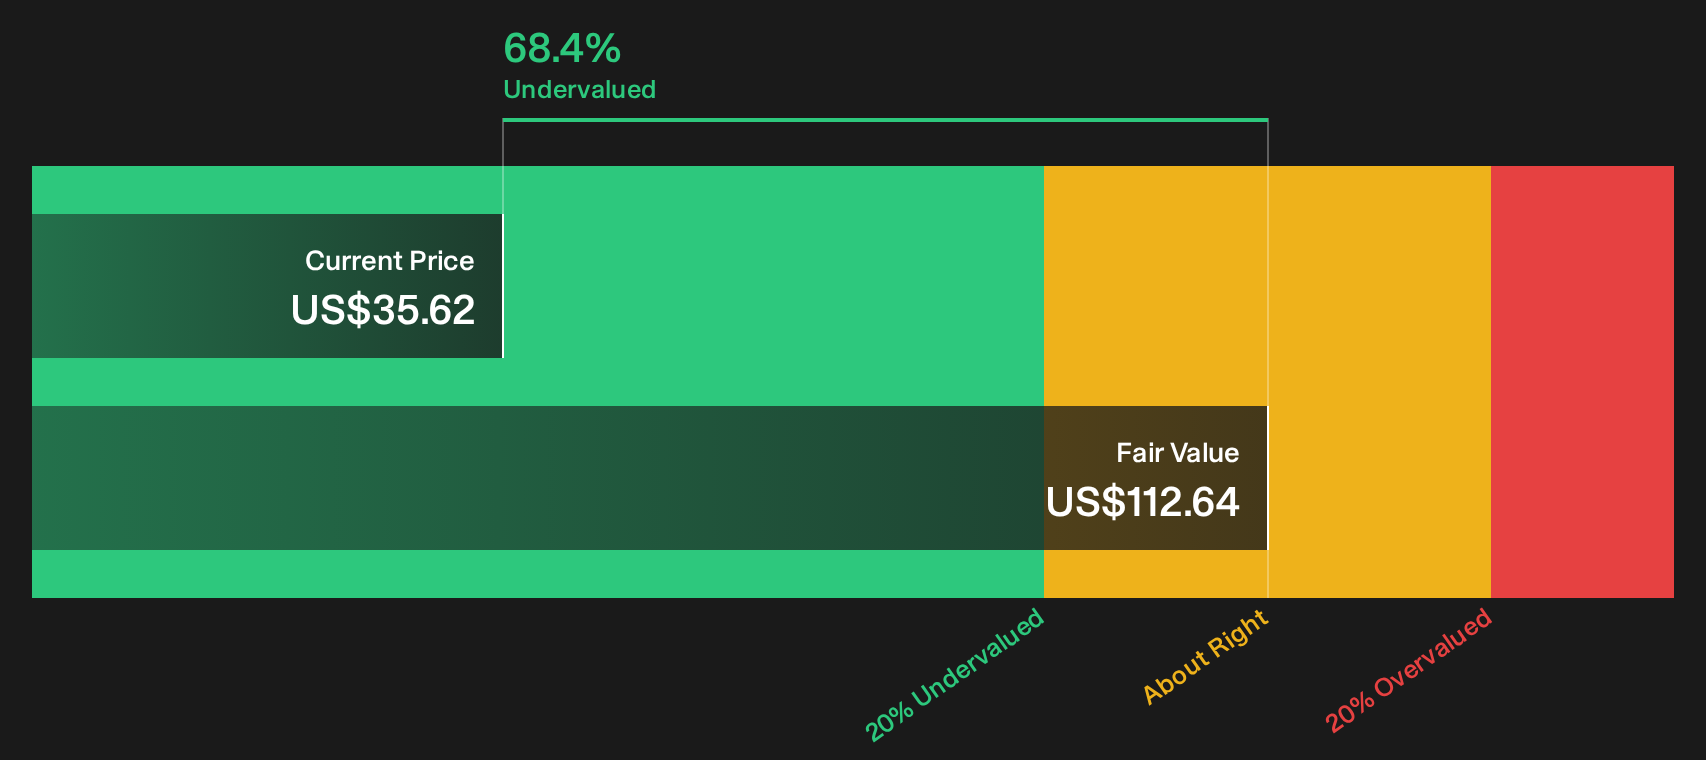
The SWS DCF model paints a far stronger picture for Radian Group. On this approach, the stock at $35.62 screens as undervalued against an estimated future cash flow value of $112.64. This implies a wide cushion for anyone focused on long term cash generation.
This kind of gap can signal either a genuine opportunity or a sign that the market is skeptical about how durable those future cash flows will be. The key question for you is simple. Do you trust the earnings based view, or does the cash flow story carry more weight for how you invest?
Look into how the SWS DCF model arrives at its fair value.
Simply Wall St performs a discounted cash flow (DCF) on every stock in the world every day (check out Radian Group for example). We show the entire calculation in full. You can track the result in your watchlist or portfolio and be alerted when this changes, or use our stock screener to discover 32 high quality undervalued stocks. If you save a screener we even alert you when new companies match - so you never miss a potential opportunity.
Next Steps
Mixed signals on Radian Group’s valuation and outlook can feel murky, so move quickly, review both the upside and the red flags, then ground your own judgment in the 5 key rewards and 1 important warning sign.
Looking for more Radian Group style investment ideas?
If Radian Group has caught your attention, do not stop at a single ticker. Broaden your watchlist today and give yourself more ways to put capital to work.
- Target potential mispricing by scanning companies that screen as high quality and potentially undervalued with the 32 high quality undervalued stocks.
- Strengthen your income stream by reviewing steady payers in the 6 dividend fortresses that focus on yield and resilience.
- Dial down portfolio stress by filtering for financially robust businesses through the 11 resilient stocks with low risk scores.
This article by Simply Wall St is general in nature. We provide commentary based on historical data and analyst forecasts only using an unbiased methodology and our articles are not intended to be financial advice. It does not constitute a recommendation to buy or sell any stock, and does not take account of your objectives, or your financial situation. We aim to bring you long-term focused analysis driven by fundamental data. Note that our analysis may not factor in the latest price-sensitive company announcements or qualitative material. Simply Wall St has no position in any stocks mentioned.
Have feedback on this article? Concerned about the content? Get in touch with us directly. Alternatively, email editorial-team@simplywallst.com