


Cembre (BIT:CMB) Stock Cools As Growth Strength Meets Valuation Strain
Cembre stock closed at €82.6 after a choppy week that left the share price slightly weaker over seven days and clearly lower over three months. The immediate read on that move is simple: short term holders are uneasy. The earnings print tells a different story. Quarterly revenue reached €72.82m with net income of €14.742m, and trailing twelve month earnings from continuing operations came in at €52.781m. The real tension now sits in the long term lens, where a rich 26.3x P/E and a share price above a discounted cash flow estimate demand patience and discipline.
Love Cembre’s earnings power but uneasy with a 26.3x P/E and a share price above discounted cash flow estimates? Compare it against our 185 high quality undervalued stocks to see how it stacks up on valuation and quality.
Q2 2026 Earnings Summary
- Revenue (Q2 2026 vs. Q2 2025): €72.82m vs. €64.373m (up about 13.1%)
- Net Income (Excl. Extra Items, Q2 2026 vs. Q2 2025): €14.742m vs. €10.72m (up about 37.5%)
- Basic EPS (Q2 2026 vs. Q2 2025): €0.8768 vs. €0.6375 (up about 37.5%)
- Net Income Margin (TTM to Q2 2026 vs. TTM to Q2 2025): 20.2% vs. 18.9% (margin improved by 1.3 percentage points)
Prefer clean charts instead of another wall of earnings tables and ratio grids? Get a full visual picture of Cembre, including how the valuation compares with its recent earnings profile, in the company report for Cembre.
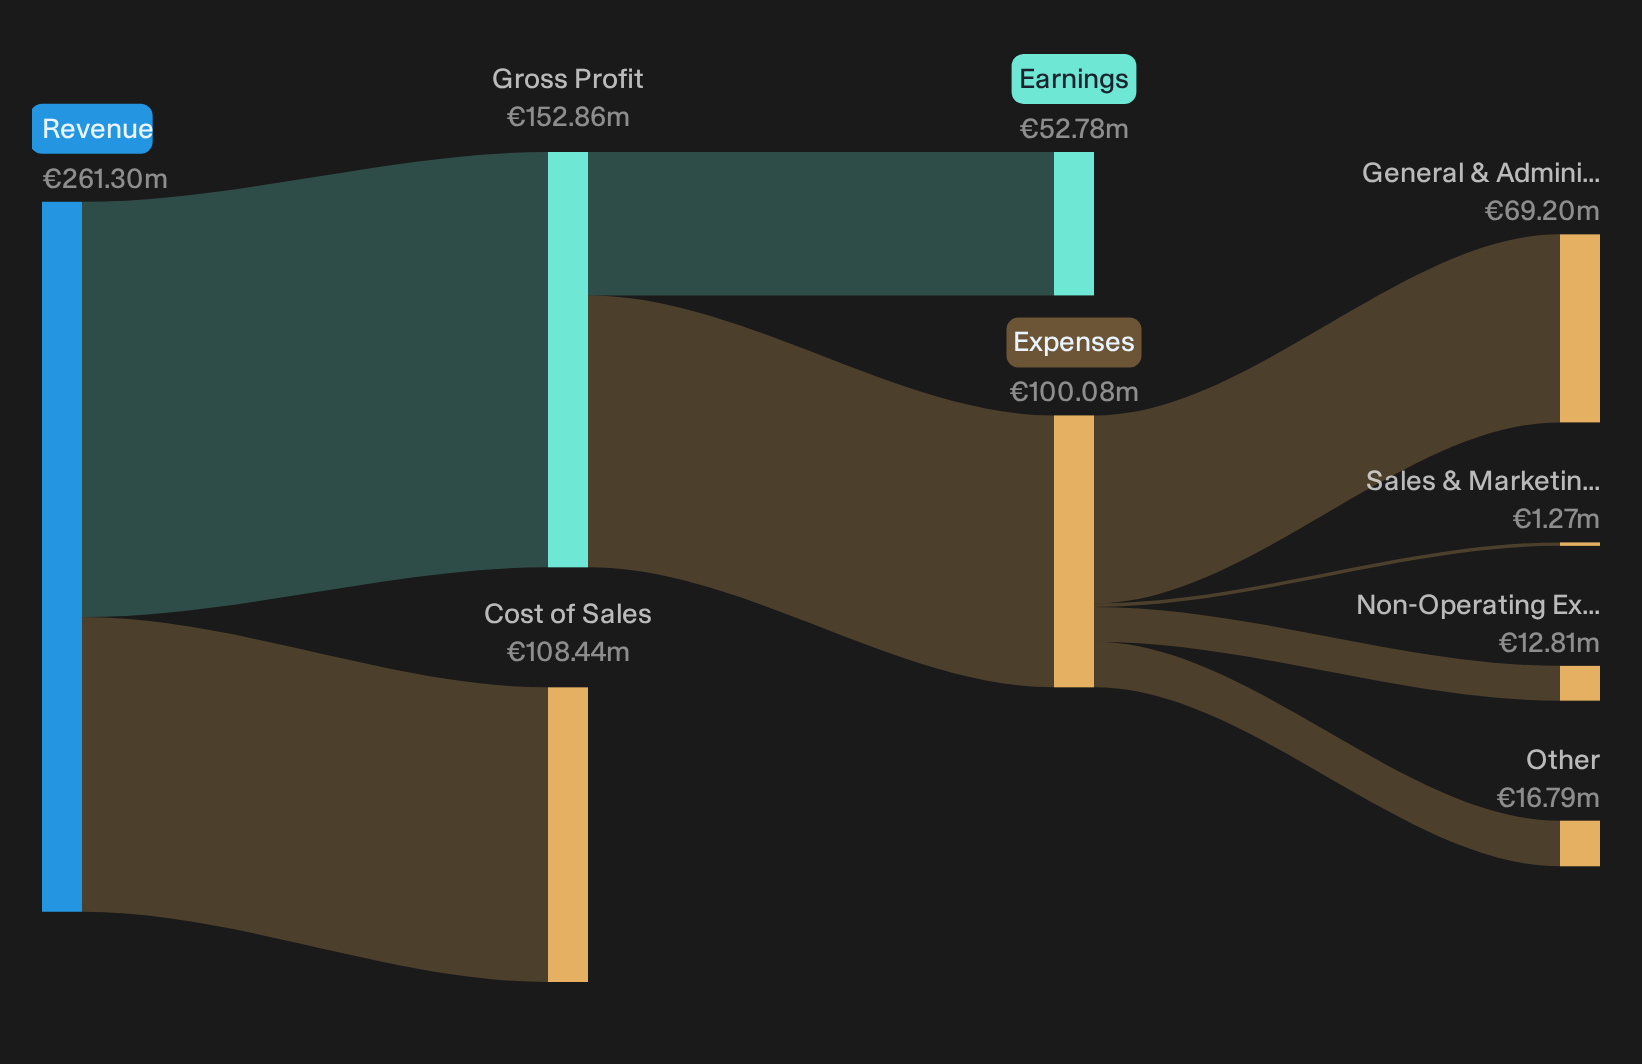
Cembre earnings that support the infrastructure story
Cembre looks like a textbook “essential infrastructure components” business when viewed through this quarter. Revenue of €72.82m and net income of €14.742m both move in the same positive direction versus last year, so the top line and profit pool are rowing together. Basic EPS rising at roughly the same pace as net income suggests shareholders are getting a clean translation of operating performance. That kind of alignment fits a thesis built on steady demand for connectors, tools, and railway gear rather than one-off windfalls.
Short term share price pressure keeps the sceptics interested
Recent returns tell a different story to the income statement. The share price fell about 1.8% over 7 days and is down roughly 11.9% over 90 days, even with earnings moving higher. That gap gives ammunition to investors who worry about cyclicality in industrial spending or softer sentiment toward smaller European manufacturers. It also means immediate market risk feels real, not theoretical. For patient holders, the key question is whether the recent price weakness reflects temporary caution or a more persistent reset in how Cembre is perceived.
Access the analyst estimates for Cembre to see where the consensus models start to diverge on Cembre’s multi year earnings path, and where the street quietly expects the next real inflection point.Stay Ahead With Simply Wall St
If Cembre’s rich 26.3x P/E and recent share price weakness have your attention, register for free with Simply Wall St and add it to your Watchlist to track price against fair value and wait for a setup that fits your plan. Once you own it, use the Portfolio Command Center to cut through market noise and focus on the key developments that really affect your holdings. For long term positioning, lean on the collective insight inside our Community to see how other investors are thinking through the same risks and opportunities. That mix of tools helps you surface hidden catalysts and potential red flags early so you can stay a step ahead of the market.
Seeking Alternatives Before The Crowd?
Fresh ideas move first. By the time every feed is talking about a breakout, the ideal entry may be gone. Scan these under the radar lists while it still matters and consider your options early.
- Explore potential income opportunities and target durable cash generators by scanning the curated 162 dividend fortresses before yields are affected by later interest.
- Pursue quality without taking on additional risk by checking the hand picked 98 resilient stocks with low risk scores while these calmer profiles are still flying below most investors’ attention.
- Monitor evolving AI demand and focus on firms already producing cash with the focused 74 profitable AI stocks that aren't just burning cash to avoid concentrating only on stories without earnings.
This article by Simply Wall St is general in nature. We provide commentary based on historical data and analyst forecasts only using an unbiased methodology and our articles are not intended to be financial advice. It does not constitute a recommendation to buy or sell any stock, and does not take account of your objectives, or your financial situation. We aim to bring you long-term focused analysis driven by fundamental data. Note that our analysis may not factor in the latest price-sensitive company announcements or qualitative material. Simply Wall St has no position in any stocks mentioned.
Have feedback on this article? Concerned about the content? Get in touch with us directly. Alternatively, email editorial-team@simplywallst.com