


Is Orient Overseas International (SEHK:316) Fully Valued On Its $2.74 Dividend?
Orient Overseas (International) (SEHK:316) has drawn fresh attention after declaring a total dividend of $2.74 per share, going ex dividend on 11 September 2026. This payout is supported by a 59% payout ratio and the company’s existing profitability.
Recent trading reflects that mixed dividend sentiment. At a share price of HK$148.9, Orient Overseas (International) has recorded a 13.93% 90 day share price return and a 17.24% year to date share price return. The 5 year total shareholder return of 126.96% points to strong longer term momentum building behind the stock.
Spot opportunities beyond Orient Overseas (International) by comparing its dividend and shipping backdrop with a curated group of 184 high quality undervalued stocks.After that sharp run, a generous dividend and softer earnings paint a more complicated picture. Does Orient Overseas (International) still offer an appealing trade off between income and risk at this price, or has the easy upside passed?
Preferred P/E of 9.7x: Is it justified?
On simple earnings math, Orient Overseas (International) trades on a P/E of 9.7x at a share price of HK$148.9, below both the wider Hong Kong market and the Asian shipping peer group yet above its own estimated fair P/E level.
The P/E ratio compares what you pay for each dollar of profit to what those earnings currently are. For a container shipping and logistics operator like Orient Overseas (International), investors often watch this measure closely because profits can move sharply as freight cycles, costs and volumes shift.
Relative to the Hong Kong market average P/E of 11.1x and the Asian shipping sector at 11.6x, the stock changes hands at a lower earnings multiple, which suggests investors are not paying a premium for its current profitability. Against that, earnings have declined by 34.5% per year over the past 5 years and are forecast to fall by an average of 22.1% annually over the next 3 years, so part of this discount can be read as the market pricing in weaker profit trends.
The estimated fair P/E for Orient Overseas (International) is 6x, materially beneath the current 9.7x level. That gap signals the share price could move closer to a lower earnings multiple if sentiment or profit expectations soften further and the valuation aligns more closely with the level implied by this fair ratio model.
To go deeper into how this fair ratio works and what it implies for upside or downside risk, check the Explore the SWS fair ratio for Orient Overseas (International).
Result: Price-to-earnings of 9.7x (OVERVALUED)
Still, the recent 22.1% projected annual earnings decline and the current trading level above the estimated fair P/E both threaten the bull case on Orient Overseas (International).
Find out about the key risks to this Orient Overseas (International) narrative.
Another View: DCF flags limited upside
The P/E picture for Orient Overseas (International) looks demanding. Our DCF model values the shares at HK$129.21, while the stock trades at HK$148.9. That pricing implies investors are paying above the modelled future cash flows, which raises the question of how much safety margin really sits in the current tag.
Look into how the SWS DCF model arrives at its fair value.
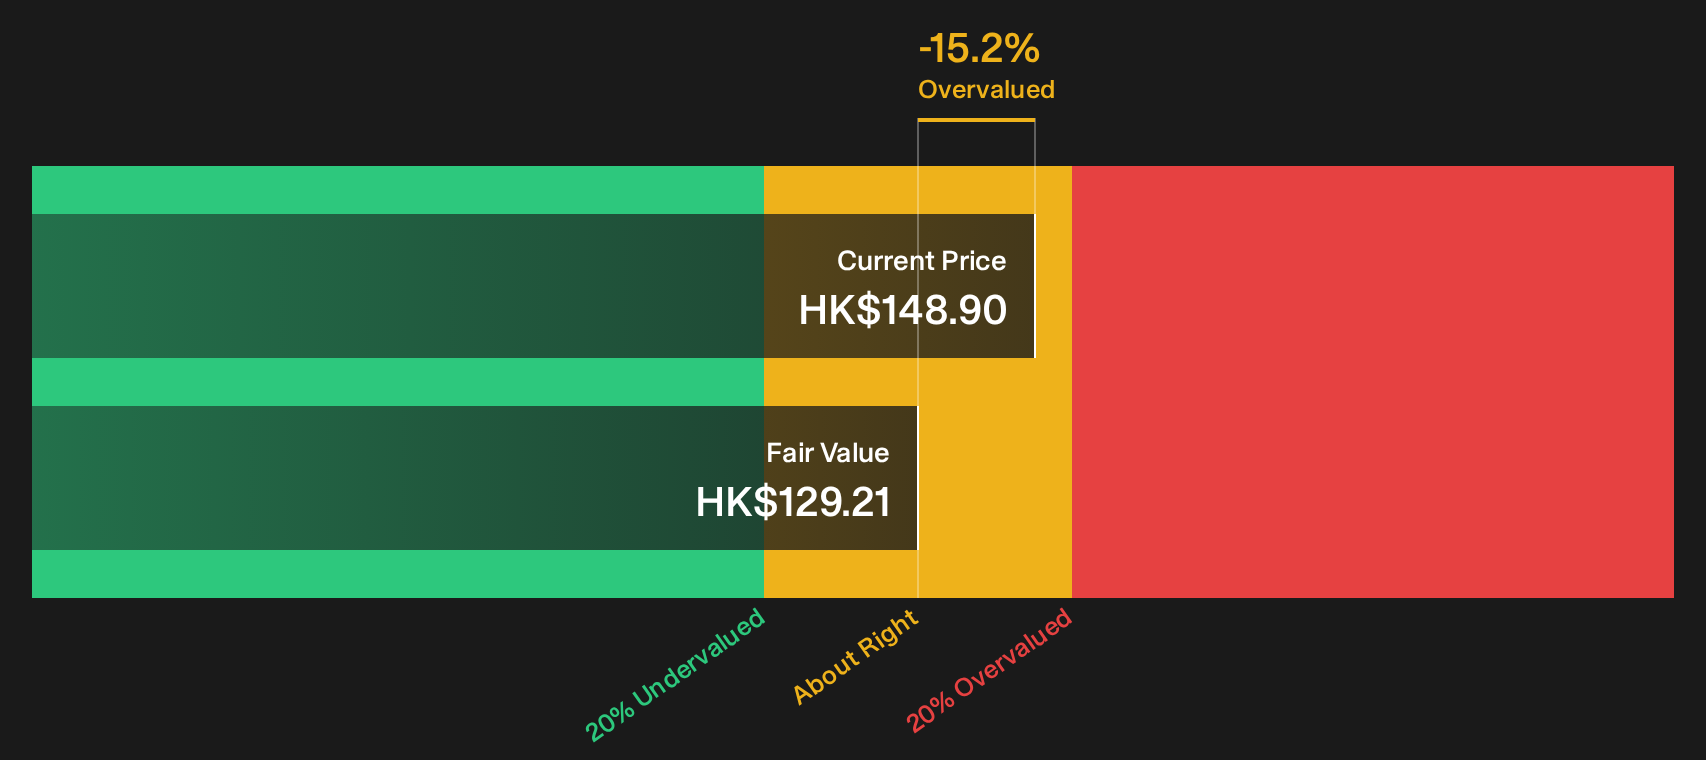
Simply Wall St performs a discounted cash flow (DCF) on every stock in the world every day (check out Orient Overseas (International) for example). We show the entire calculation in full. You can track the result in your watchlist or portfolio and be alerted when this changes, or use our stock screener to discover 184 high quality undervalued stocks. If you save a screener we even alert you when new companies match - so you never miss a potential opportunity.
Next Steps
If the mixed signals around Orient Overseas (International) feel unresolved, use that tension as your cue to move fast and inspect the details yourself. The data already highlights both concern and optimism, so pressure test the story from both sides by reviewing the 1 key reward and 4 important warning signs.
Ready for more ideas beyond Orient Overseas (International)?
Orient Overseas (International) may be your starting point today, but the strongest portfolios often come from comparing several clear, data backed opportunities side by side.
- Target resilient income streams by scanning a focused set of higher yielding candidates through the 164 dividend fortresses.
- Hunt for potential mispricing by reviewing a curated pool of companies that screen as attractively valued in the 184 high quality undervalued stocks.
- Prioritize capital preservation first and shortlist steadier candidates with the 97 resilient stocks with low risk scores.
This article by Simply Wall St is general in nature. We provide commentary based on historical data and analyst forecasts only using an unbiased methodology and our articles are not intended to be financial advice. It does not constitute a recommendation to buy or sell any stock, and does not take account of your objectives, or your financial situation. We aim to bring you long-term focused analysis driven by fundamental data. Note that our analysis may not factor in the latest price-sensitive company announcements or qualitative material. Simply Wall St has no position in any stocks mentioned.
Have feedback on this article? Concerned about the content? Get in touch with us directly. Alternatively, email editorial-team@simplywallst.com