


Theon International (ENXTAM:THEON) Following H1 Results And Guidance Still Looks Reasonably Valued
Theon International (ENXTAM:THEON) has moved into focus after reporting half year 2026 results and issuing full year revenue guidance of about €600 million, giving investors fresh numbers to reassess expectations for the defense electronics group.
Recent price action around Theon International reflects this mix of fresh guidance and earnings detail. The share price is now €32.44, with a 1-day share price return of 1.38% and a 7-day gain of 2.85% after the half-year results and revenue outlook, even though the 30-day share price return is down 13.12%. Over a longer stretch, momentum still leans positive, with a year-to-date share price return of 21.95% and a 1-year total shareholder return of 29.24%. This suggests investors have been willing to pay more as they reassess growth potential and risk around the defense electronics pipeline.
Capitalize on the renewed interest in Theon International by scanning a carefully curated 619 high quality undiscovered gems that could be drawing far less attention than their earnings potential deserves.Theon International now trades well above last year’s levels but has just absorbed a sharp 30 day pullback. Does that mix of guidance, earnings and price reset still leave the risk reward tilted toward buyers?
Price-to-Earnings of 20.8x: Is it justified for Theon International?
On the latest close at €32.44, Theon International is being valued at a P/E of 20.8x, which puts a premium on its recent profitability compared with some peers, while still sitting below the broader European Aerospace & Defense sector.
The P/E ratio compares the current share price to earnings per share and effectively tells you how many euros investors are willing to pay for each euro of profit. For Theon International, this is a useful yardstick because the group is already profitable, with net income of about €120.96m on revenue of roughly €508.42m and a current net profit margin of 23.8% compared with 19% last year.
A P/E of 20.8x suggests the market is already ascribing value to Theon International's track record of earnings growth, where profit expanded 66.2% over the past year and about 39% per year over five years. That said, this valuation also needs to sit alongside forecasts that earnings are expected to grow 12.7% per year, which is slower than the 17.4% per year forecast for the Dutch market, even as revenue is projected to rise 17% annually and exceed broader market top line growth of 10.8% per year.
Relative to the wider European Aerospace & Defense industry, the 20.8x P/E is lower than the sector average of 32.7x, which points to a discount against larger listed peers in the space. Compared with Theon International's own peer group, where the average P/E is 15.3x, the stock trades on a richer multiple, and it also sits above an estimated fair P/E of 18.3x that regression analysis suggests the market could move toward over time.
Explore the SWS fair ratio for Theon International
Result: Price-to-Earnings of 20.8x (ABOUT RIGHT).
Still, the recent 30 day share price pullback and reliance on a single Optronics segment leave Theon International exposed if contracts or margins disappoint.
Find out about the key risks to this Theon International narrative.
Another View on Theon International’s Valuation
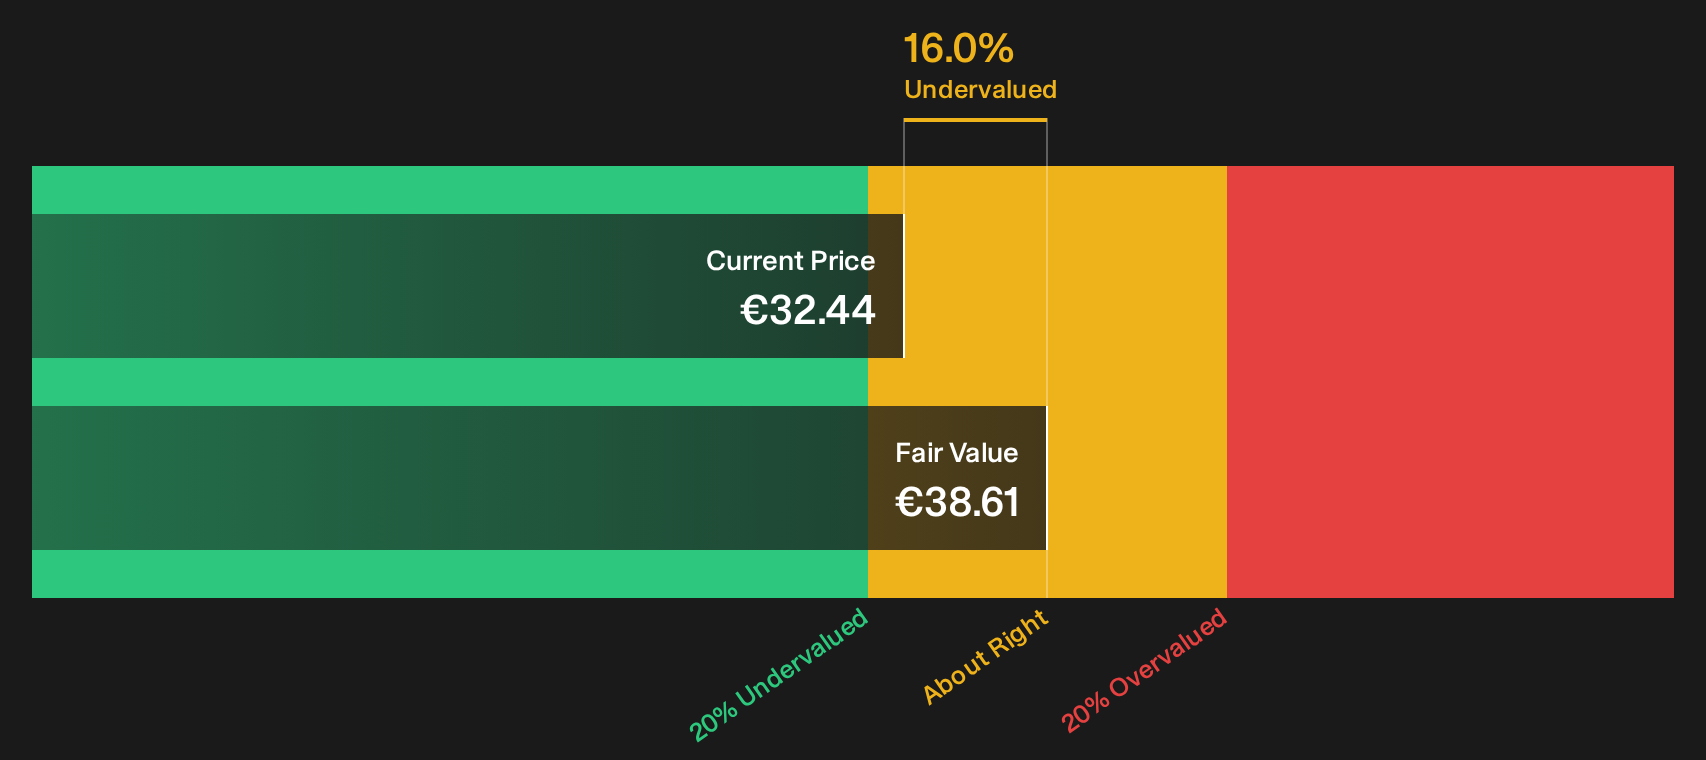
Theon International screens as good value on earnings compared with the wider European Aerospace & Defense sector, yet our DCF model points to something stronger. With an estimated future cash flow value of about €38.61 per share against a market price of €32.44, the stock screens around 16% below that mark. Does that gap reflect genuine upside, or just optimistic modelling that could close quickly if cash generation softens?
Look into how the SWS DCF model arrives at its fair value.
Simply Wall St performs a discounted cash flow (DCF) on every stock in the world every day (check out Theon International for example). We show the entire calculation in full. You can track the result in your watchlist or portfolio and be alerted when this changes, or use our stock screener to discover 183 high quality undervalued stocks. If you save a screener we even alert you when new companies match - so you never miss a potential opportunity.
Next Steps
Mixed signals around Theon International’s valuation and guidance can pull you in both directions, so move quickly, test the assumptions yourself, and weigh both the downside alerts and upside drivers by digging into the 4 key rewards and 2 important warning signs.
Ready for more ideas beyond Theon International?
If Theon International has you rethinking your watchlist, you can use this momentum to refresh your broader opportunity set with a few focused screeners right now.
- Target potential mispricing by scanning a curated set of companies that combine strong fundamentals with modest expectations through the 183 high quality undervalued stocks.
- Strengthen portfolio resilience by filtering for businesses with clean balance sheets and solid financial footing using the list of solid balance sheet and fundamentals (193 results).
- Aim for steadier cash returns by reviewing a focused pool of higher yielding payers through the 166 dividend fortresses.
This article by Simply Wall St is general in nature. We provide commentary based on historical data and analyst forecasts only using an unbiased methodology and our articles are not intended to be financial advice. It does not constitute a recommendation to buy or sell any stock, and does not take account of your objectives, or your financial situation. We aim to bring you long-term focused analysis driven by fundamental data. Note that our analysis may not factor in the latest price-sensitive company announcements or qualitative material. Simply Wall St has no position in any stocks mentioned.
Have feedback on this article? Concerned about the content? Get in touch with us directly. Alternatively, email editorial-team@simplywallst.com