


IMAX (IMAX) Could Be 7% Undervalued On Record Summer Box Office Momentum
IMAX (IMAX) is back in focus after reporting its highest grossing summer ever at the global box office, led by Christopher Nolan's The Odyssey and a record 5.8% box office share.
That backdrop has come with strong share price momentum for IMAX, with the stock up 22.51% on a 90-day share price return and 43.25% year to date. The 1-year total shareholder return of 66.18% and 5-year total shareholder return above 200% point to gains that investors have been willing to stick with despite a small pullback in the latest session.
Spot similar big-screen momentum by scanning the curated 17 high quality undiscovered gems, which, like IMAX, are turning audience attention into meaningful box office and earnings power.After a 22.51% move in three months and a 66.18% total return over one year, IMAX now trades only about 8% below the average analyst target and intrinsic estimate. Does that gap still look like genuine mispricing, or is it just noise?
Most Popular Narrative: 7.3% Undervalued
IMAX closed at $51.60, a touch below the most followed fair value estimate of $55.65, which frames the current enthusiasm against a slightly discounted narrative.
Diversification of content offerings, including local-language blockbusters, alternative content (concerts, live events), and deeper relationships with streaming and tech partners like Apple, Amazon, and Netflix, is broadening IMAX's audience base and improving margin mix, contributing to higher contribution per screen and more resilient earnings.
Read the complete narrative. Read the complete narrative.
There is a detailed playbook sitting behind that $55.65 figure. It mixes steady box office growth, rising profitability, and a richer content slate. Want to see which revenue and earnings assumptions have to land almost perfectly for this valuation gap to close, or widen, from here
Result: Fair Value of $55.65 (UNDERVALUED)
Have a read of the narrative in full and understand what's behind the forecasts.
Still, IMAX relies heavily on a steady slate of blockbuster releases and on consumers choosing theaters over at-home options, which can both shift quickly.
Find out about the key risks to this IMAX narrative.
Another View: IMAX Through The P/E Lens
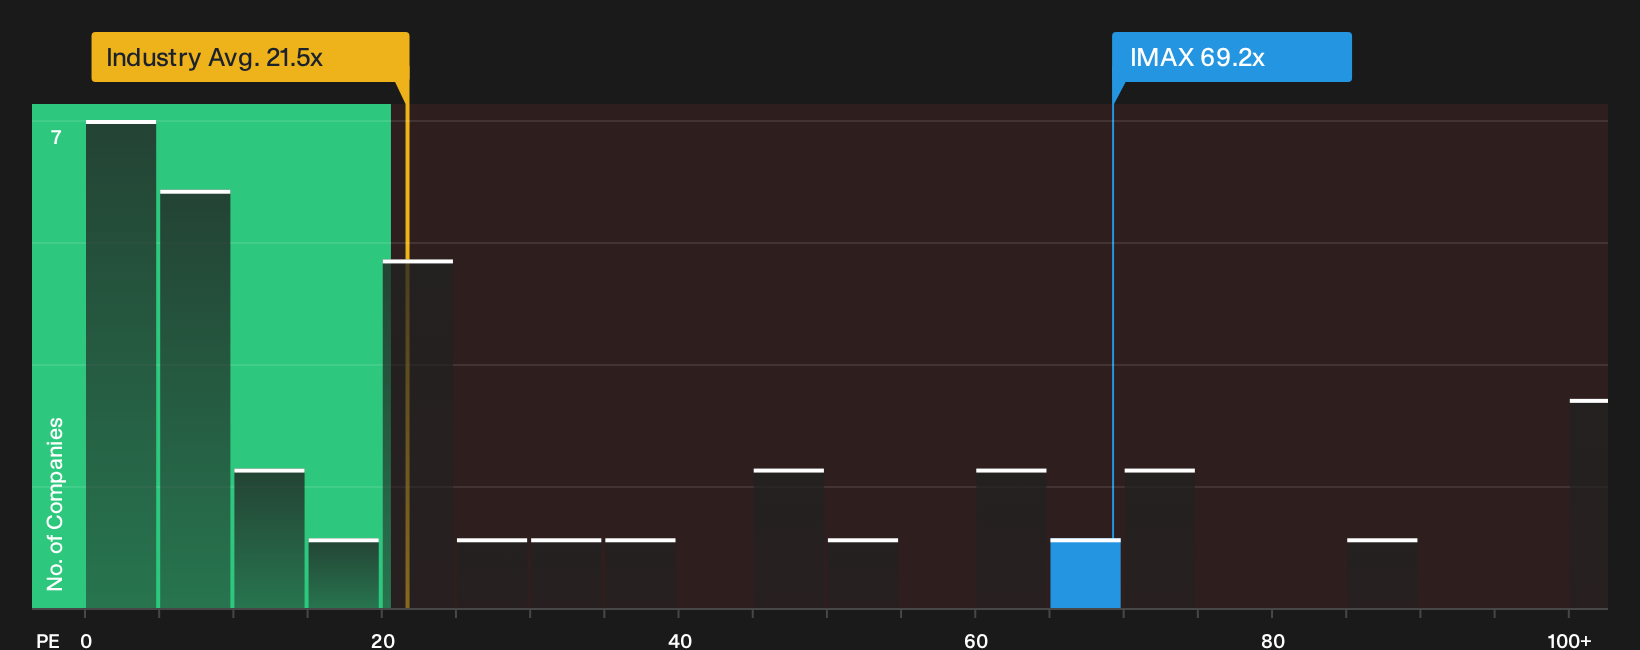
IMAX may look modestly undervalued on fair value estimates around $55 to $56, yet its current P/E of 69.2x tells a very different story. That multiple is more than double the US Entertainment industry average of 21.6x and also well above the fair ratio of 21.5x that the market could move toward over time. For investors, that gap points to meaningful valuation risk if sentiment cools or earnings do not keep pace with the price.
Given that contrast, the key question is simple: Is this premium multiple paying upfront for years of future execution, or is it a signal to slow down and test your assumptions before acting on the IMAX story?
See what the numbers say about this price — find out in our valuation breakdown.
Next Steps
Mixed messages on IMAX valuation and risk can be confusing. Move quickly, review both sides of the story, and ground your own stance in the 3 key rewards and 2 important warning signs.
Looking for more investment ideas beyond IMAX?
IMAX may be front of mind right now, but your portfolio deserves a wider bench of opportunities that match different goals, timelines, and risk levels.
Use the Simply Wall St Screener today so you do not miss stocks that quietly match your criteria before they attract broader attention.
- Target potential bargains early by reviewing a curated 31 high quality undervalued stocks that combines quality fundamentals with prices that still look reasonable.
- Prioritise resilience by scanning a list of solid balance sheet and fundamentals (24 results) so you can focus on businesses with stronger financial footing.
- Lock in potential income ideas by checking a handpicked 6 dividend fortresses that highlights companies offering higher yields with staying power.
This article by Simply Wall St is general in nature. We provide commentary based on historical data and analyst forecasts only using an unbiased methodology and our articles are not intended to be financial advice. It does not constitute a recommendation to buy or sell any stock, and does not take account of your objectives, or your financial situation. We aim to bring you long-term focused analysis driven by fundamental data. Note that our analysis may not factor in the latest price-sensitive company announcements or qualitative material. Simply Wall St has no position in any stocks mentioned.
Have feedback on this article? Concerned about the content? Get in touch with us directly. Alternatively, email editorial-team@simplywallst.com