


Eli Lilly (LLY) Stock Still Looks Discounted After A Very Large Run
Eli Lilly has produced a very large 5 year gain while current valuation checks suggest the stock may still trade below an intrinsic value estimate based on projected cash flows. Recent share price softness contrasts with a Discounted Cash Flow (DCF) view and market multiples that both point to undervaluation, which puts the recent run in sharp focus for anyone trying to price the next phase.
- The stock has returned 404.6% over 5 years, which means long term holders have already seen substantial value creation priced in.
- Approval of Mounjaro to reduce cardiovascular risk can support expectations for future cash flows, while drug development setbacks such as the failed Lp(a) trial read across may remind investors that pipeline assumptions carry real downside risk.
- Eli Lilly carries a mixed overall valuation profile, with a value score of 4 that points to some signs of undervaluation but not a clear across the board bargain.
The issue now is whether Eli Lilly's current market price already reflects the intrinsic value implied by cash flow models and recent news, or whether there is still a material gap left for investors to consider.
Spot similar risk and reward setups by scanning the hand picked 49 high quality undervalued stocks that, like Eli Lilly, combine strong rerating histories with valuation signals that still suggest a potential discount.Is Eli Lilly a Bargain on Cash Flow?
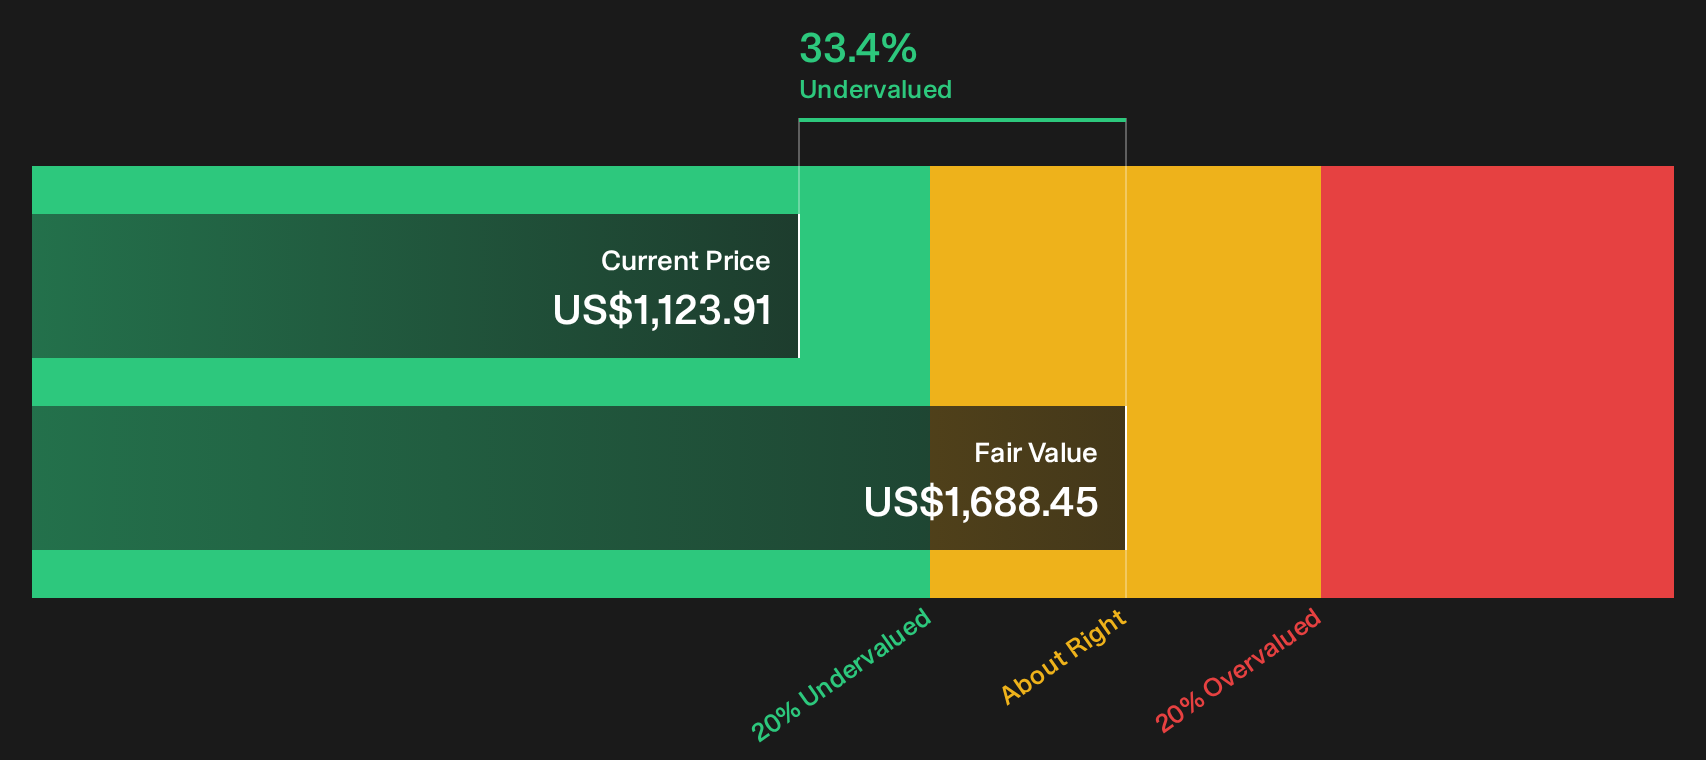
The Discounted Cash Flow (DCF) model here takes Eli Lilly’s projected free cash flows and discounts them back to today. On that basis, the latest twelve month free cash flow sits at about $13.6b, with analysts and internal estimates pointing to growing cash generation over the next decade rather than a shrinking or flat profile. When those projected streams are brought back to the present, the model points to an intrinsic value of about $1,688 per share.
Compared with the current market price, that DCF output implies Eli Lilly screens roughly 33.4% undervalued. FDA approval of Mounjaro for reducing cardiovascular risk provides a clearer medical use case for the cash flow story, yet the share price still trails the value implied by those projections. The upshot of this cash flow workup is that Eli Lilly appears undervalued relative to what its projected dollars justify.
Our Discounted Cash Flow (DCF) analysis suggests Eli Lilly is undervalued by 33.4%. Track this in your watchlist or portfolio, or discover 49 more high quality undervalued stocks.
Does Eli Lilly Look Undervalued on Earnings?
P/E is a useful lens for Eli Lilly because earnings remain the key anchor for how investors price its drug portfolio and pipeline.
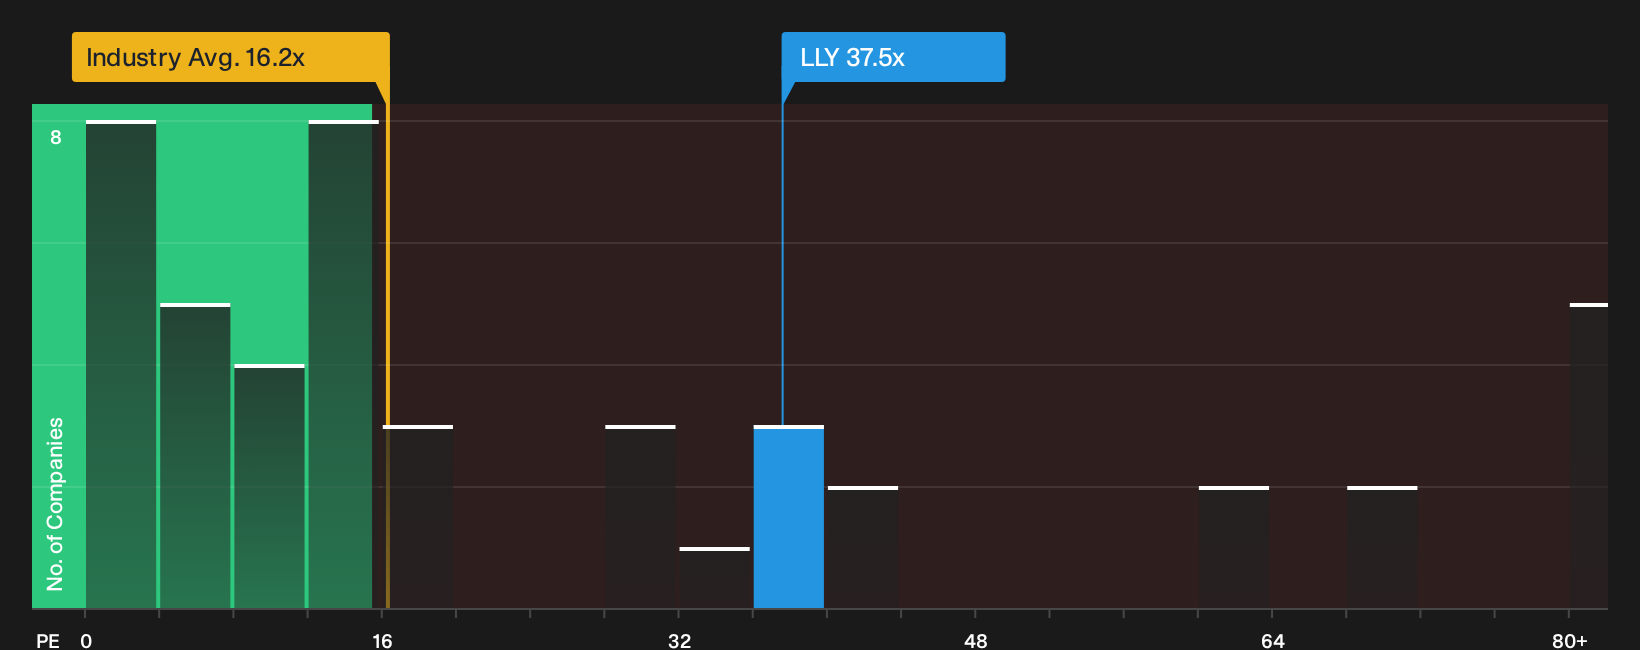
The stock trades on a P/E of about 37.5x, compared with a Pharmaceuticals industry average near 16.2x. Against a peer group average of roughly 49.3x, Eli Lilly changes hands at a lower multiple than many large-cap rivals. A fair P/E of about 45.4x, based on factors such as margins, size and risk profile, sits meaningfully above the current level, which indicates the valuation does not fully match that implied benchmark.
Putting those pieces together, Eli Lilly appears expensive relative to the broad sector but cheaper than similar peers and below the tailored fair multiple that models its fundamentals.
On earnings, Eli Lilly stock screens undervalued relative to the P/E level suggested by its own fundamentals and peer group.
See what the numbers say about this price — find out in our valuation breakdown.
The Eli Lilly Narrative: What Would Justify Today's Price?
Simply Wall St Narratives for Eli Lilly pick up where the valuation puzzle leaves off. They spell out which assumptions about Eli Lilly's future growth, margins and earnings would need to hold for the shares to be worth materially more or less than today’s price, and they sit on Simply Wall St's Community page. Rather than relying on a single multiple or model, each narrative presents its own fair value assumptions so you can track them against future results.
Eli Lilly inspires very different stories right now, with one community camp leaning heavily into the GLP-1 upside and another focused on concentration and pricing risk.
Bull case: 5% undervalued
"Mounjaro (for type 2 diabetes) and Zepbound (obesity) each grew rapidly in 2024, and Zepbound jumping from $4.9B (2024) to $12.5 B in 2025 (and $18.1B in 2026)…"
Read the full Bull Case to see why Eli Lilly could be undervalued
Bear case: 14% overvalued
"Heavily concentrated revenue in a narrow set of leading drugs, including Mounjaro, Zepbound, and Trulicity, makes Lilly especially vulnerable to the loss of market share from patent expiry, biosimilar and generic entrants (including Canadian and compounded generics) and possible adverse data…"
Read the full Bear Case to see why Eli Lilly could be overvalued
Do you think there's more to the story for Eli Lilly? Head over to our Community to see what others are saying!
The Bottom Line
Eli Lilly screens undervalued on both Discounted Cash Flow (DCF) work and earnings multiples, which is unusual after such a strong 5 year run. The DCF framework points to a sizeable gap to intrinsic value, while the P/E comparison suggests the stock trades cheaper than similar peers despite a rich sector headline multiple. Broad valuation checks are mixed rather than emphatic. The key question is whether current expectations for Mounjaro, Zepbound and the wider pipeline prove resilient enough to justify those cash flow forecasts rather than this discount reflecting concentration and execution risk.
This article by Simply Wall St is general in nature. We provide commentary based on historical data and analyst forecasts only using an unbiased methodology and our articles are not intended to be financial advice. It does not constitute a recommendation to buy or sell any stock, and does not take account of your objectives, or your financial situation. We aim to bring you long-term focused analysis driven by fundamental data. Note that our analysis may not factor in the latest price-sensitive company announcements or qualitative material. Simply Wall St has no position in any stocks mentioned.
Have feedback on this article? Concerned about the content? Get in touch with us directly. Alternatively, email editorial-team@simplywallst.com