


KeyCorp (KEY) Stock Trades At A Discount To Fair Value After A 114% Run
KeyCorp has quietly turned in a 114.1% three year return, yet current valuation checks still lean on the conservative side, with both the Excess Returns intrinsic value estimate and market multiples pointing to an undervalued stock rather than obvious froth.
- A 114.1% gain over three years sets a high bar for what happens next, because such a move can compress the margin of safety if fundamentals do not keep pace.
- The appointment of Chris Doll as chief strategy officer may support efforts to sharpen capital allocation. However, any stumble in executing on that refreshed playbook can weigh on how much value investors are willing to pay for KeyCorp.
- The broader checks present a mixed picture rather than a clear bargain or clear overpricing, with KeyCorp scoring 4 out of 6 on value tests.
The issue now is whether KeyCorp's current share price already reflects those underlying value signals or if there is still a reasonable discount built in.
Scan how KeyCorp's valuation story compares with other potential opportunities by lining up its Excess Returns profile against 49 high quality undervalued stocks.
Does KeyCorp Look Undervalued on Excess Returns?
Excess Returns values KeyCorp by comparing what it is expected to earn on its equity against the return investors demand. The model uses a Book Value of $16.14 per share and a Stable EPS estimate of $2.02 per share, both grounded in weighted forecasts from 9 analysts. With an Average Return on Equity of 11.95% and a Cost of Equity of $1.24 per share, the framework points to an Excess Return of $0.78 per share supported by a Stable Book Value of $16.87 per share.
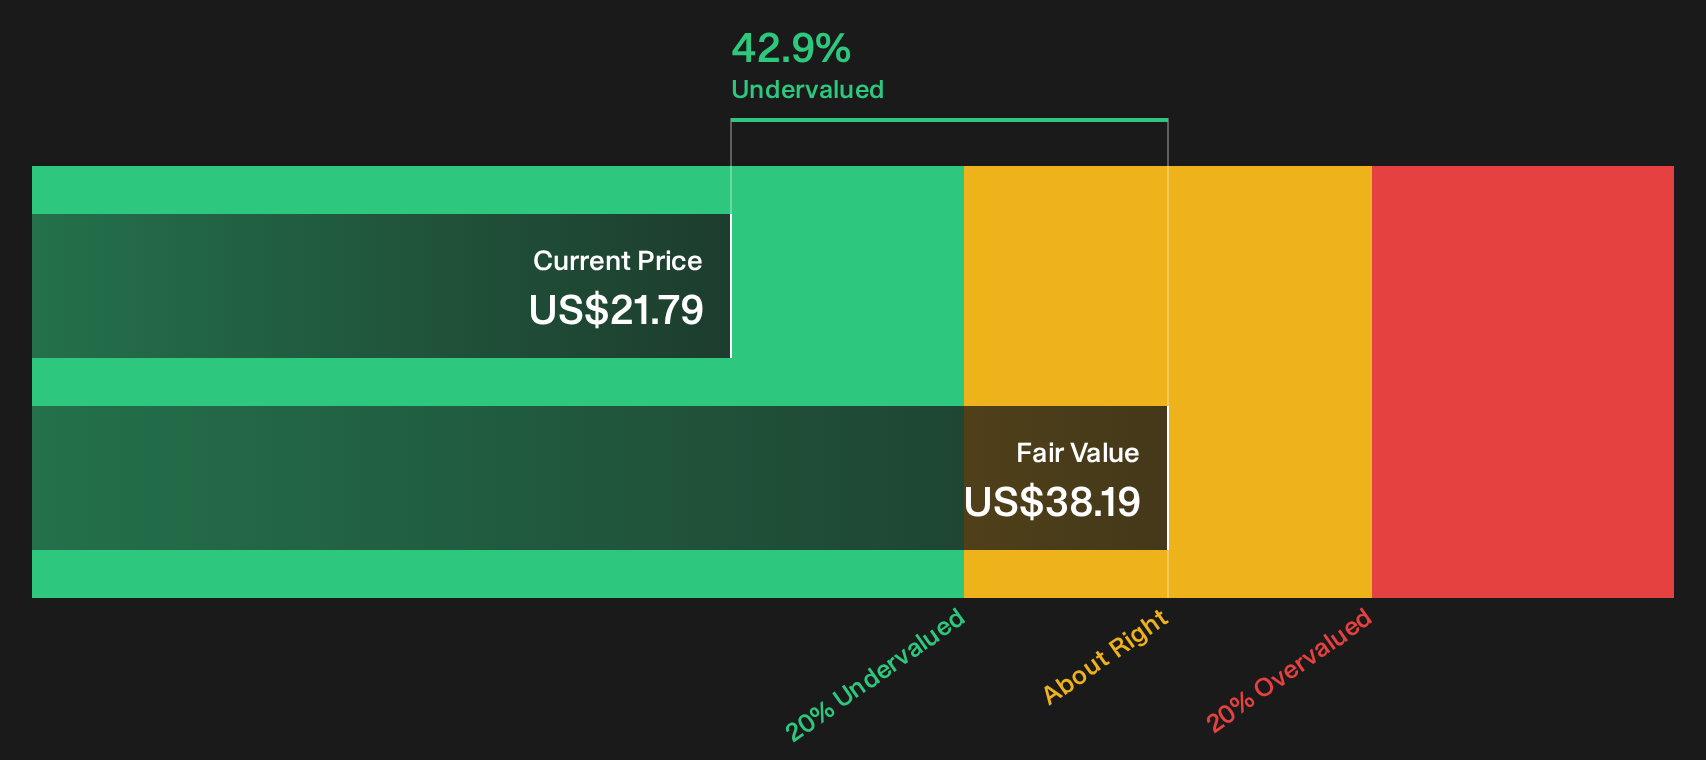
Those inputs lead to an intrinsic value estimate of $38.19 per share. This figure is well above where KeyCorp currently trades and indicates the stock is about 42.9% undervalued. The recent appointment of Chris Doll as chief strategy officer and deputy finance chief gives management a clearer capital allocation voice, yet the share price still does not fully reflect the earnings power implied by these equity returns.
On this Excess Returns view, KeyCorp currently appears undervalued relative to its estimated intrinsic worth.
Our Excess Returns analysis suggests KeyCorp is undervalued by 42.9%. Track this in your watchlist or portfolio, or discover 49 more high quality undervalued stocks.
Is KeyCorp a Bargain on Earnings?
P/E suits a bank like KeyCorp because earnings remain the cleanest anchor for how the market usually prices lenders.
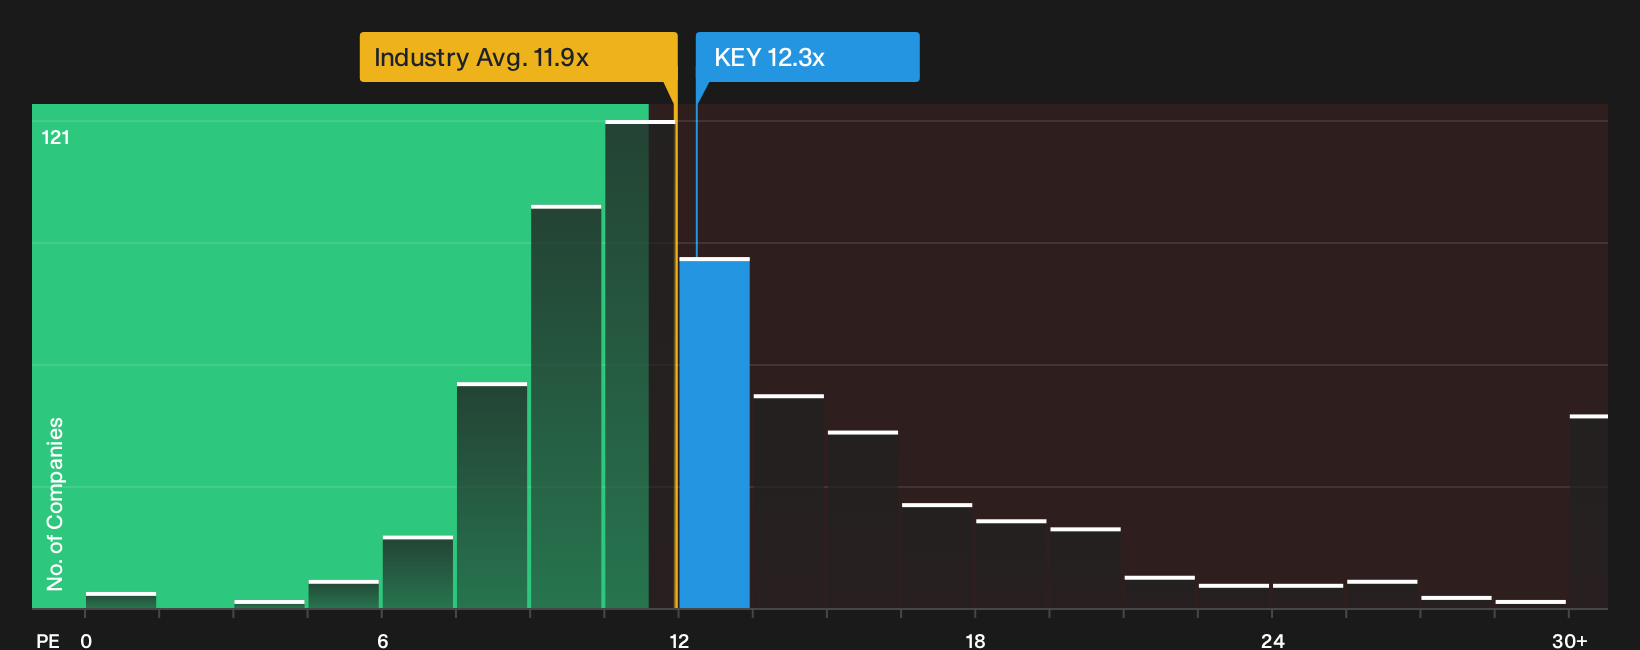
KeyCorp currently trades on a P/E of 12.3x. That sits slightly above the wider Banks sector on 11.9x, yet below the 15.0x peer group average. The gap to direct comparables suggests investors are still assigning a modest discount to the stock relative to similar institutions, even though the sector indicator does not flag a large premium.
The tailored fair P/E ratio for KeyCorp is 14.1x, based on its mix of scale, profitability profile, risk and sector backdrop. That benchmark is higher than where the shares trade today, which highlights a gap between the current earnings multiple and what the model indicates as reasonable.
On this P/E yardstick, KeyCorp appears undervalued compared with the earnings multiple implied by its fair ratio.
See what the numbers say about this price — find out in our valuation breakdown.
The KeyCorp Narrative: What Would Justify Today's Price?
Simply Wall St Narratives pick up where the valuation puzzle for KeyCorp leaves off by spelling out what specific paths for growth, profitability and earnings would need to occur for the stock to be worth materially more or materially less than today’s price on the Community page. Each scenario links its numbers to a clear view on where KeyCorp's growth rates, margin profile and key risks could move next, which you can revisit as fresh information emerges.
One of the top community narratives on KeyCorp: 16% undervalued
"Strong growth in the national third party commercial loan servicing business, providing a counter cyclical revenue stream and insights into the commercial real estate market…"
Read one of the top narratives on KeyCorp
Do you think there's more to the story for KeyCorp? Head over to our Community to see what others are saying!
The Bottom Line
KeyCorp screens as undervalued on both the Excess Returns intrinsic value work and the tailored P/E check, so the valuation story leans more supportive than cautious. The mixed overall value score keeps that in check and hints that not every metric is lining up in the same direction. What really decides it from here is whether management converts that capital allocation focus into earnings consistency that the market is willing to reward with even a modest re rating of the multiple.
This article by Simply Wall St is general in nature. We provide commentary based on historical data and analyst forecasts only using an unbiased methodology and our articles are not intended to be financial advice. It does not constitute a recommendation to buy or sell any stock, and does not take account of your objectives, or your financial situation. We aim to bring you long-term focused analysis driven by fundamental data. Note that our analysis may not factor in the latest price-sensitive company announcements or qualitative material. Simply Wall St has no position in any stocks mentioned.
Have feedback on this article? Concerned about the content? Get in touch with us directly. Alternatively, email editorial-team@simplywallst.com