


What’s Going On With China Overseas Property Holdings (SEHK:2669)?
China Overseas Property Holdings (SEHK:2669) has been dropped from the Hang Seng China Affiliated Corporations Index, an adjustment that can reshape how index-tracking funds treat the stock and influence short term trading flows.
At a share price of HK$3.545, China Overseas Property Holdings has seen a 1-month share price return of 4.26% and a 7-day gain of 2.60%. However, the 1-year total shareholder return is down 29.48% and the 3-year total shareholder return has fallen 57.68%, which points to short-term momentum building after a much tougher stretch for longer-term holders.
Compare how China Overseas Property Holdings stacks up against other property and real estate players facing index and valuation pressures by scanning our curated list of 249 high quality undervalued stocks today.
Short term buyers see China Overseas Property Holdings firming up after its index exit, while longer term holders are still sitting on steep declines. Is it more reasonable to increase exposure now, or to wait for a cheaper reset before undertaking detailed valuation work?
Preferred P/E of 7.7x for China Overseas Property Holdings: Is it justified?
On a headline view, China Overseas Property Holdings trades on a P/E of 7.7x, which screens as inexpensive compared to both its own peers and the wider Hong Kong real estate group.
The P/E ratio links the current share price to earnings per share and gives a quick read on how much you are paying for each unit of profit. For a property services operator with HK$15,283.876m in revenue and HK$1,297.175m in net income, this yardstick helps frame what the market is currently willing to pay for its earnings profile.
Context matters. Earnings for China Overseas Property Holdings have grown by 12.5% per year over the past 5 years, even though the most recent year saw profit decline 16.1% and net profit margins fall from 10.7% to 8.5%. That mix of longer term profit expansion and recent pressure can help explain why the stock trades at a relatively low earnings multiple while still being described as trading at good value compared to peers and the sector.
The comparison gets sharper when set against other real estate players. China Overseas Property Holdings is assessed as good value versus the Hong Kong real estate industry average P/E of 9x, and even more so against a peer average of 22.3x. Relative to an estimated fair P/E of 9.2x, the current 7.7x level implies scope for the market multiple to move closer to that reference point if sentiment improves or earnings stabilise.
To see how this fair ratio is calculated in detail, review the Explore the SWS fair ratio for China Overseas Property Holdings.
Result: Price-to-earnings of 7.7x (UNDERVALUED)
Still, the recent index removal and a 1-year total return that declined almost 30% leave China Overseas Property Holdings exposed if sentiment or contract visibility weakens further.
Find out about the key risks to this China Overseas Property Holdings narrative.
Another View on China Overseas Property Holdings Valuation
The earnings multiple paints China Overseas Property Holdings as inexpensive, yet the SWS DCF model goes further and values the stock at HK$7.95 per share versus the current HK$3.55, suggesting it trades at a steep discount. If that gap closes only part way, how would you want to be positioned?
Look into how the SWS DCF model arrives at its fair value.
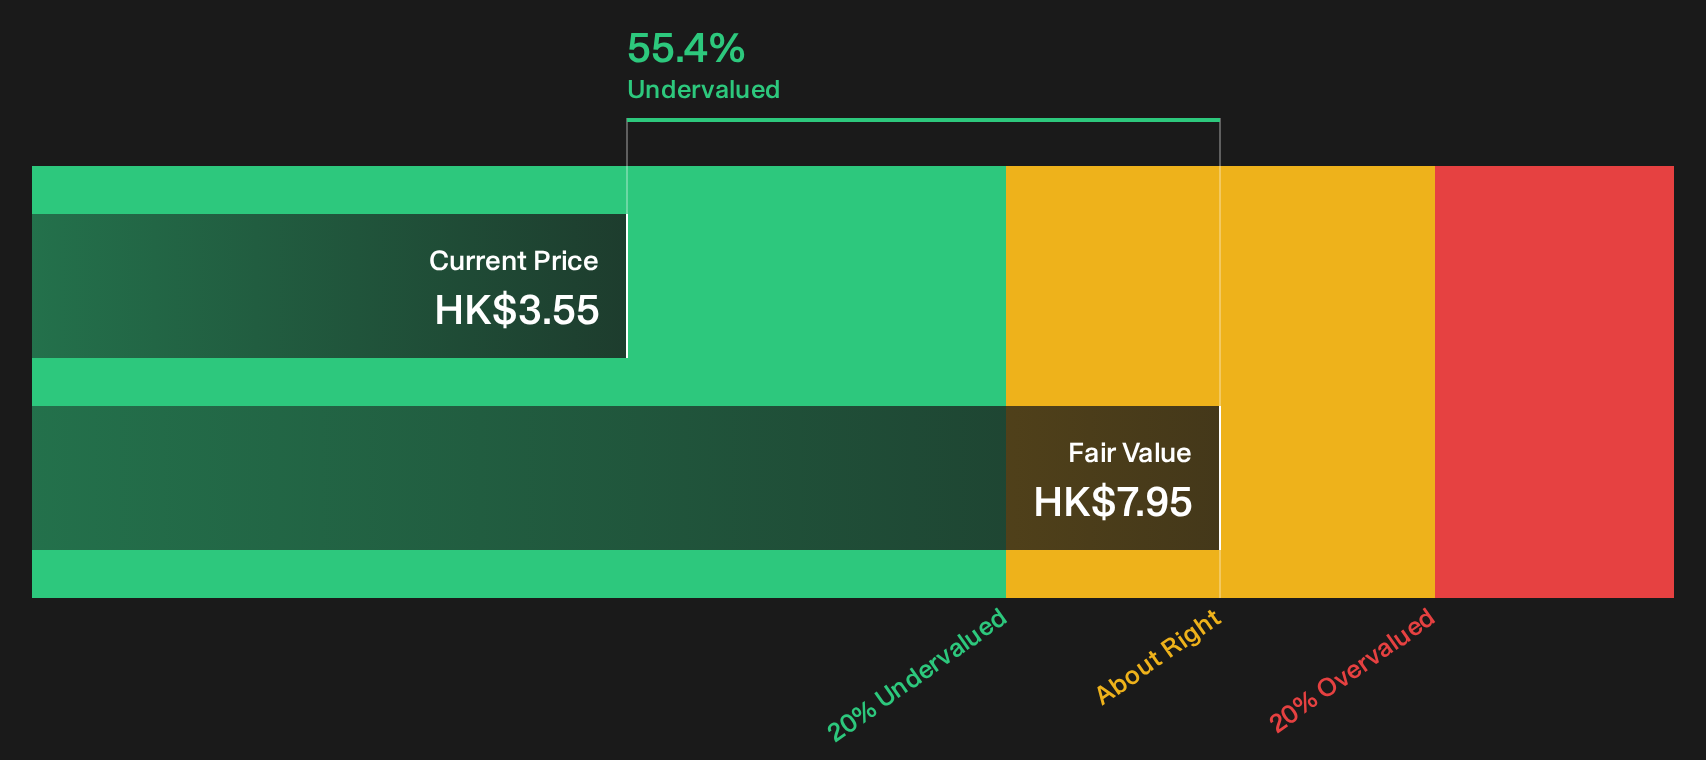
Simply Wall St performs a discounted cash flow (DCF) on every stock in the world every day (check out China Overseas Property Holdings for example). We show the entire calculation in full. You can track the result in your watchlist or portfolio and be alerted when this changes, or use our stock screener to discover 249 high quality undervalued stocks. If you save a screener we even alert you when new companies match - so you never miss a potential opportunity.
Next Steps
Sentiment on China Overseas Property Holdings is mixed, with pressure and optimism sitting side by side. Move quickly, test the numbers yourself, and ground your own stance using the full breakdown of 4 key rewards and 1 important warning sign
Looking for more investment ideas beyond China Overseas Property Holdings?
If China Overseas Property Holdings has you rethinking your watchlist, treat this as a prompt to refresh your broader opportunity set using targeted screeners on Simply Wall St.
Use the screener to shortcut your research and focus on ideas that match your risk appetite, income needs, and preference for balance sheet strength or value.
- Target resilient cash generators by reviewing companies with strong financial buffers through the list of solid balance sheet and fundamentals (194 results).
- Hunt for potential mispricing by scanning the 249 high quality undervalued stocks that combine quality fundamentals with what the market currently prices cheaply.
- Spot potential future leaders early by tracking the 617 high quality undiscovered gems that have solid metrics but limited market attention so far.
This article by Simply Wall St is general in nature. We provide commentary based on historical data and analyst forecasts only using an unbiased methodology and our articles are not intended to be financial advice. It does not constitute a recommendation to buy or sell any stock, and does not take account of your objectives, or your financial situation. We aim to bring you long-term focused analysis driven by fundamental data. Note that our analysis may not factor in the latest price-sensitive company announcements or qualitative material. Simply Wall St has no position in any stocks mentioned.
Have feedback on this article? Concerned about the content? Get in touch with us directly. Alternatively, email editorial-team@simplywallst.com