


What Berkshire Hathaway (BRK.A)'s AI Buying Spree Means For Shareholders
- Berkshire Hathaway has started to put a large cash reserve to work under CEO Greg Abel, cutting its nearly US$400b cash and T bill pile through bigger positions in Alphabet, added exposure to Delta Air Lines and Macy's, and a larger round of Berkshire share repurchases.
- The shift toward technology and AI linked holdings, combined with a more active buyback program, marks a clear change in how Berkshire Hathaway balances liquidity, growth opportunities and capital returns compared with Warren Buffett's historically more cautious deployment pace.
- The next key question is how this more assertive use of Berkshire Hathaway's cash, particularly around AI exposure, reshapes its investment narrative.
Scan how Berkshire Hathaway’s AI tilt compares with other potential opportunities by reviewing the hand picked 55 AI infrastructure stocks shaping the data center build out story.
What Is Berkshire Hathaway's Investment Narrative?
Owning Berkshire Hathaway means buying into a very specific story. You need to believe this collection of insurers, rail, utilities and manufacturers can keep turning huge cash flows into solid long term value, even if reported earnings move around. The recent move under Greg Abel to trim a roughly US$397b cash and T bill position, lean into Alphabet and other AI exposed holdings, and step up Berkshire share repurchases ties directly to that belief. Operations still hinge on execution in insurance underwriting, pricing power at BNSF, capital intensive energy projects and steady retail and manufacturing demand. In the near term, the real swing factors are how effectively Berkshire allocates its US$365b plus cash pile and whether more AI related bets and buybacks offset forecasts that earnings could decline an average 7.2% per year over the next 3 years.
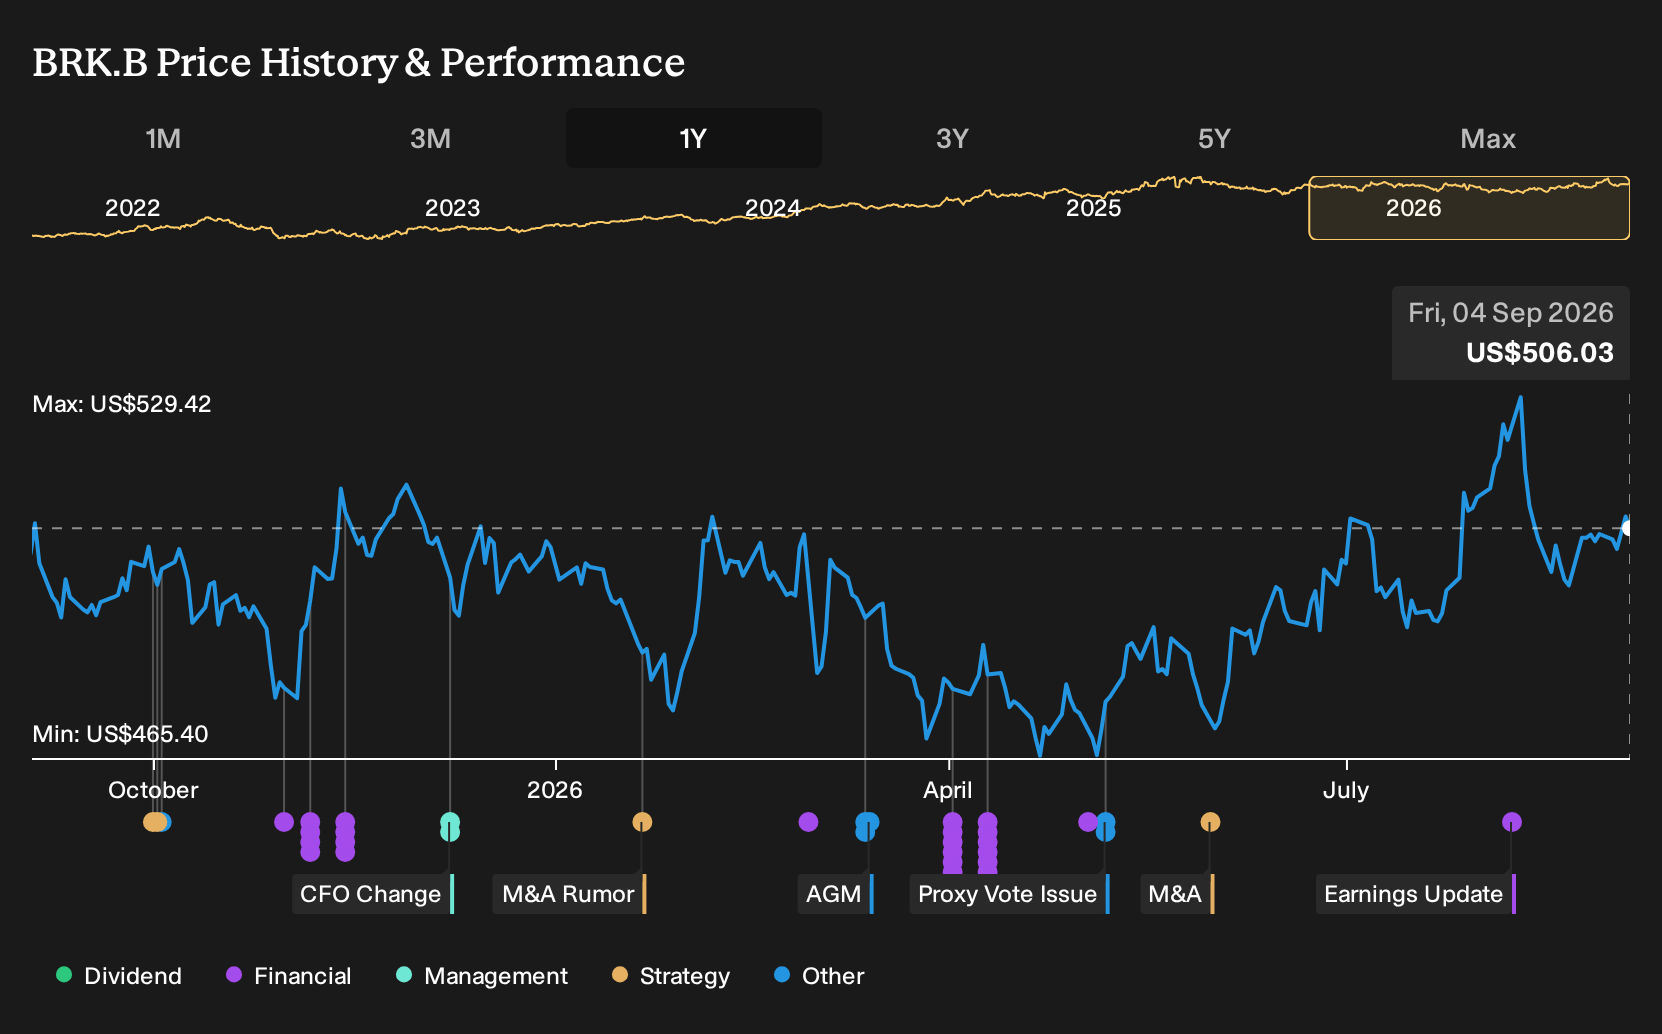
Short term market moves look modest. The stock is up about 1% over 7 days, down roughly 2.7% over 30 days and ahead about 2% year to date, while earnings over the past year rose 36.3% and net income growth on the latest annual figure is lower by 7.2%. That mix points to investors weighing near term caution against a longer record of 6.1% annual profit growth over 5 years and high quality earnings. With Berkshire trading on a 12.6x P/E compared with both peer and industry averages above that level, and around 35.8% below one estimate of fair value, the recent acceleration in capital deployment into AI exposed assets and buybacks feels material for the story. The big operational risk is whether that more assertive playbook still fits a group where revenue is only forecast to rise about 4.3% a year and return on equity is projected at 6.1% in three years.
That said, there is one tension between Berkshire Hathaway's huge cash firepower, its AI tilt and the way its funding is structured that ...
There's only one way to know the right time to buy, sell or hold Berkshire Hathaway. Head to Simply Wall St's company report for the latest analysis of Berkshire Hathaway's Fair Value.
Exploring Other Perspectives
Three fair value estimates from the Simply Wall St Community span roughly US$799,503 to about US$1,182,036 per Berkshire Hathaway share, which already shows how far opinions can stretch. You now have retail investors weighing those numbers against fresh AI investments, big cash reserves and potential rate moves that can influence financing costs and deal appetite. Exploring several of these viewpoints can help you stress test your own thesis.
If you want to see how other investors frame the potential value range of Berkshire Hathaway, you can compare those views using 2 other fair value estimates for Berkshire Hathaway.
The Verdict Is Yours
Don't just follow the ticker. Dig into the data and build a conviction that's truly your own.
- A great starting point for your Berkshire Hathaway research is our analysis highlighting 3 key rewards and 1 important warning sign that could impact your investment decision.
- See our latest analysis for Berkshire Hathaway. The report includes a comprehensive fundamental analysis summarized in a single visual, the Snowflake, making it easy to evaluate Berkshire Hathaway's overall financial health at a glance.
Looking For More Ideas Beyond Berkshire Hathaway?
Once you have a view on Berkshire Hathaway, it can be useful to weigh that thesis against other opportunities with different risk profiles, income potential and balance sheet strength using the Simply Wall St Screener.
- If you want potential value combined with quality fundamentals, scan a curated set of opportunities through the 49 high quality undervalued stocks.
- If steadier income is a priority, focus on companies with higher yields by reviewing the 6 dividend fortresses.
- If resilience matters most to you, filter for financially robust businesses using the 83 resilient stocks with low risk scores.
This article by Simply Wall St is general in nature. We provide commentary based on historical data and analyst forecasts only using an unbiased methodology and our articles are not intended to be financial advice. It does not constitute a recommendation to buy or sell any stock, and does not take account of your objectives, or your financial situation. We aim to bring you long-term focused analysis driven by fundamental data. Note that our analysis may not factor in the latest price-sensitive company announcements or qualitative material. Simply Wall St has no position in any stocks mentioned.
Have feedback on this article? Concerned about the content? Get in touch with us directly. Alternatively, email editorial-team@simplywallst.com