


Stryker (SYK) Stock Could Be 28% Undervalued After A Shoulder Tech Deal
Stryker stock has had a tough year, with the share price down 22% over the past 12 months, yet several valuation checks still point to meaningful upside relative to an intrinsic value estimate. The Discounted Cash Flow (DCF) assessment suggests the market price lags this intrinsic value, while broader metrics show a more mixed picture.
- The 1 year decline of 22% signals investors have cooled on Stryker recently, even though the longer term performance remains positive on a 3 and 5 year view.
- Recent moves to acquire ZuriMED and the first FDA authorized surgery using SportSuite Vision on Apple Vision Pro can support expectations for future cash flows, while any integration issues or slower adoption of new technology may weigh on what investors are willing to pay.
- A value score of 4 out of 6 points to a mixed picture rather than a clear bargain or clear overvaluation. Both the Discounted Cash Flow (DCF) estimate and market multiples currently screen Stryker as undervalued.
The issue now is whether the current discount to intrinsic value gives enough margin of safety after a year of weaker share performance.
Spot 49 high quality undervalued stocks that, like Stryker after its 22% 1-year slide, appear potentially mispriced based on both discounted cash flow estimates and market multiples.Is Stryker Still Cheap on Cash Flow?
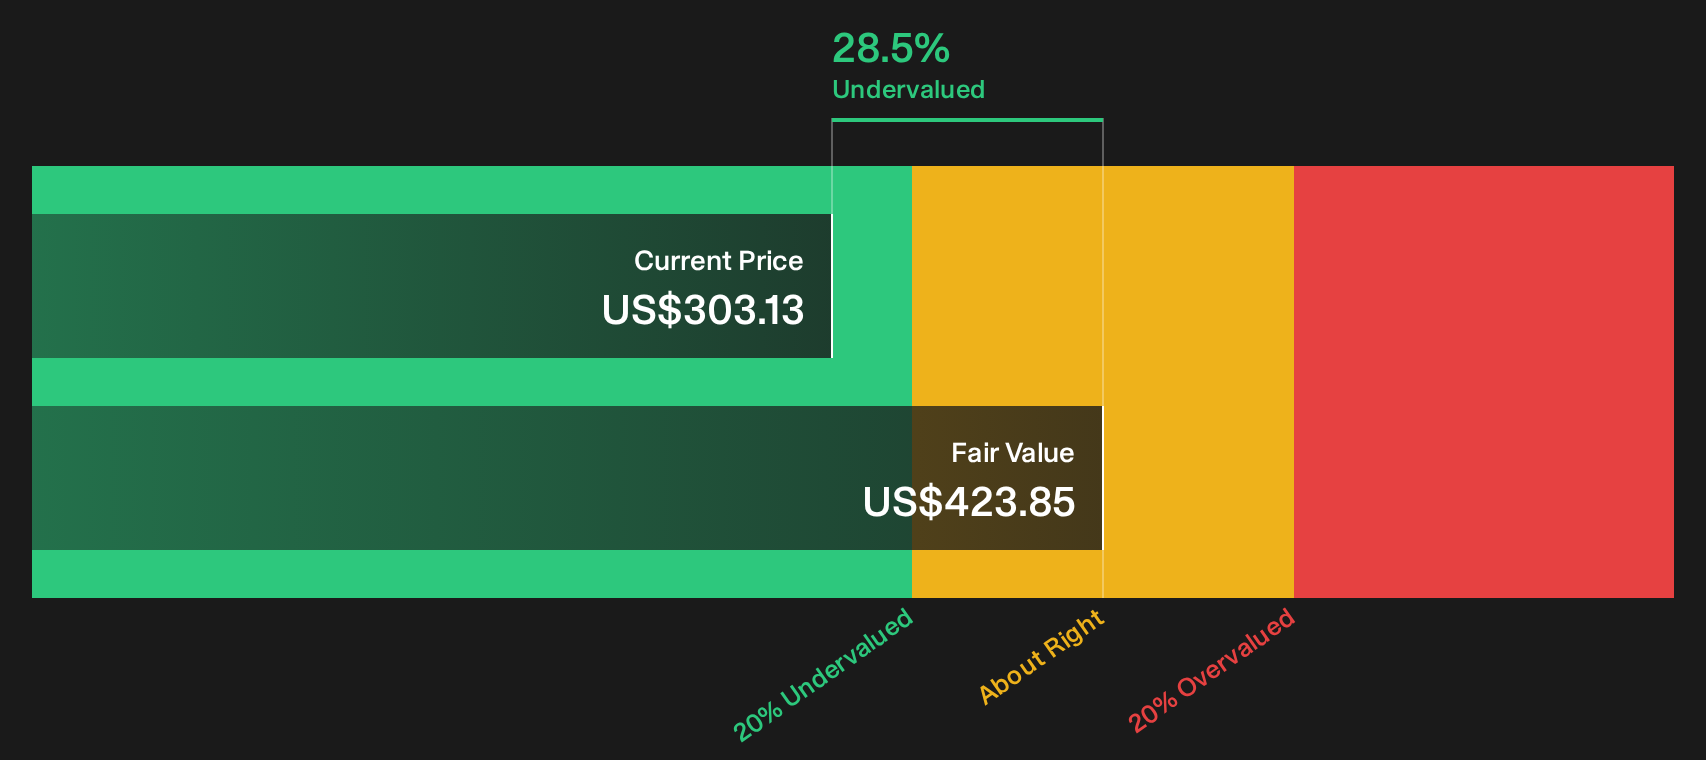
The Discounted Cash Flow (DCF) approach values Stryker based on the cash it can generate for shareholders over time. On this model, the latest twelve-month free cash flow is about $4.7 billion, with the projection set assuming growing cash flows rather than a shrinking business. That stream is capitalized into an estimated intrinsic value of about $423 per share.
Compared with the current market price, that intrinsic value implies the stock trades at roughly a 28.5% discount, so Stryker appears undervalued on cash generation alone. The planned acquisition of ZuriMED, which broadens Stryker’s shoulder repair offering, helps explain why the cash flow outlook in the model leans toward continued growth even after a weaker share price period.
On this DCF view, Stryker appears undervalued relative to what its projected cash flows in dollars suggest the shares could be worth.
Our Discounted Cash Flow (DCF) analysis suggests Stryker is undervalued by 28.5%. Track this in your watchlist or portfolio, or discover 49 more high quality undervalued stocks.
Is Stryker Still Cheap on Earnings?
P/E works well for Stryker because earnings quality usually sits at the center of how investors frame established medical equipment businesses.
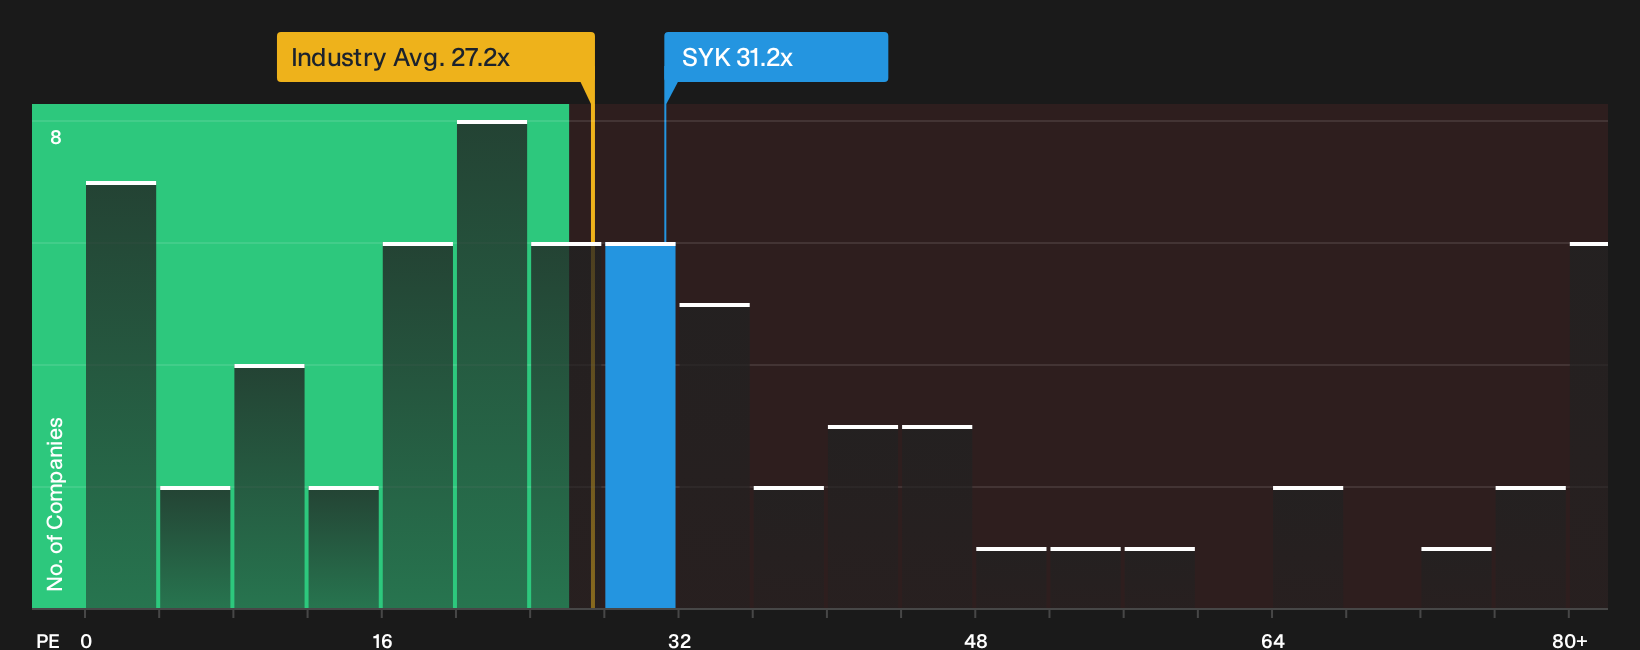
The stock currently trades on a P/E of 31.2x. That is a premium to the wider Medical Equipment industry on 27.2x and a smaller uplift versus the peer group average at 29.5x. On raw comparison, you are paying more per dollar of profit than the typical sector listing.
The modelled fair P/E ratio for Stryker is 34.7x, which is higher than where the shares change hands today. That gap suggests the current price implies a lower earnings multiple than the one indicated by its mix of size, profitability profile and sector risk.
Taken together, the P/E work indicates that Stryker appears undervalued relative to the earnings multiple the fair value framework assigns to it.
See what the numbers say about this price — find out in our valuation breakdown.
The Stryker Narrative: What Would Justify Today's Price?
Stryker’s valuation work raises a simple question for you as an investor. What kind of future would have to unfold for today’s price to look conservative or stretched? Simply Wall St Narratives bridge that gap by tying explicit assumptions about Stryker’s future growth, margins and earnings to possible outcomes for the share price. Each scenario links a fair value to a clear mix of potential catalysts and risks that you can track over time.
One of the top community narratives on Stryker: 22% undervalued
"Successful integration and expansion of recently acquired businesses, combined with ongoing focus on operating efficiencies and digital health investments, should drive continued improvements in net margins and EPS growth..."
Read one of the top narratives on Stryker
Do you think there's more to the story for Stryker? Head over to our Community to see what others are saying!
The Bottom Line
Stryker screens as undervalued on both the Discounted Cash Flow (DCF) intrinsic value estimate and the earnings multiple work, which is a relatively clean alignment for a mature medical equipment business. The key question is whether the cash generation and profit profile that underpin those models hold up as recent acquisitions bed in and new technology is adopted at scale. If those assumptions prove realistic, today’s gap between market price and intrinsic value could eventually close. If integration or execution risks bite harder than expected, that discount may simply reflect the market already pricing in those pressures.
This article by Simply Wall St is general in nature. We provide commentary based on historical data and analyst forecasts only using an unbiased methodology and our articles are not intended to be financial advice. It does not constitute a recommendation to buy or sell any stock, and does not take account of your objectives, or your financial situation. We aim to bring you long-term focused analysis driven by fundamental data. Note that our analysis may not factor in the latest price-sensitive company announcements or qualitative material. Simply Wall St has no position in any stocks mentioned.
Have feedback on this article? Concerned about the content? Get in touch with us directly. Alternatively, email editorial-team@simplywallst.com