


Should Record FX Open Interest Require Action From CME Shares Investors?
- CME Group reported that its FX futures and options reached a record open interest of 4,410,167 contracts on September 4, 2026, with large open interest holders climbing to 1,446 and asset managers exceeding US$200b in notional FX futures open interest for the first time.
- The surge in open interest and asset manager participation highlights how CME Group's FX complex is becoming a deeper risk management venue for institutional investors and reinforces the importance of derivatives activity within the business model.
- Next, the focus shifts to how this record FX open interest shapes CME Group's broader investment narrative and expected earnings power.
Scan other exchanges, first operators built around derivatives and risk transfer by jumping into our hand picked list of 17 high quality undiscovered gems that may be flying under most investors’ radar.
CME Group Investment Narrative Recap
Owning CME Group means believing that deep, liquid derivatives markets will stay central to how institutions manage risk, even if overall volatility cools. The immediate swing factor is whether today’s record FX activity feeds through to sustained volumes across interest rate and equity contracts, which remain key revenue engines. The most important short term catalyst is simple: you want to see whether this broad participation in FX, especially from asset managers, shows up in higher trading and clearing activity across the platform. The main near term risk is that market calm reduces contract turnover before new products scale.
The launch of E mini Equity Factor futures looks especially relevant alongside the FX open interest record. Both point in the same direction: CME Group is leaning into more granular tools that let institutions fine tune equity and currency exposure rather than just trade broad benchmarks. The factor suite also plugs directly into one of the core catalysts, which is steady product expansion that keeps clients on exchange and in clearing. Operationally, this widens the menu without changing the basic risk. If volatility dries up or competitors undercut fees, more contracts on the shelf may not be enough.
That said, before you assume this expanded FX and equity toolkit insulates CME Group from the next quiet period, keep one thing in mind about...
Read the full CME Group narrative to see the case behind these numbers.
CME Group Earnings Setup Behind The FX Story
CME Group's FX surge plugs into a consensus earnings path that is already mapped out in some detail. Analysts are building their models around a revenue line that is projected to grow by 5.6% a year over the next few years, while accepting that profit margins could ease off their current levels. Forecasts point to earnings of US$4.6b by 2029, compared with US$4.3b today. This implies an increase of about US$0.3b in profit even as the margin profile softens.
CME Group's narrative projects US$8.0b in revenue and US$4.6b in earnings by 2029. This assumes 5.6% yearly revenue growth and an earnings increase of about US$0.3b from US$4.3b today.
The bigger question for you is how that earnings bridge might be funded by the kind of FX activity now showing up in open interest. If higher participation in currency contracts helps keep overall trading and clearing volumes healthy while margins drift from 63.1% toward 58.3%, then the business can still hit those profit targets without relying on extreme volatility. Analysts also bake in a small reduction in share count over the next few years, which slightly amplifies earnings per share even if the absolute profit line does not accelerate dramatically.
Valuation work on CME Group then layers a market multiple on top of that earnings path. Consensus views cluster around a price target that assumes the business earns US$4.6b in 2029 on US$8.0b of revenue and trades on a P/E of 27.3x at that point, using a discount rate near 7.8%. The current cluster of targets, from US$230 to US$330, indicates that analysts are not aligned on how durable these revenue and earnings paths are, or how much to pay for them. That spread matters if you care about how much of the FX story is already reflected in the share price.
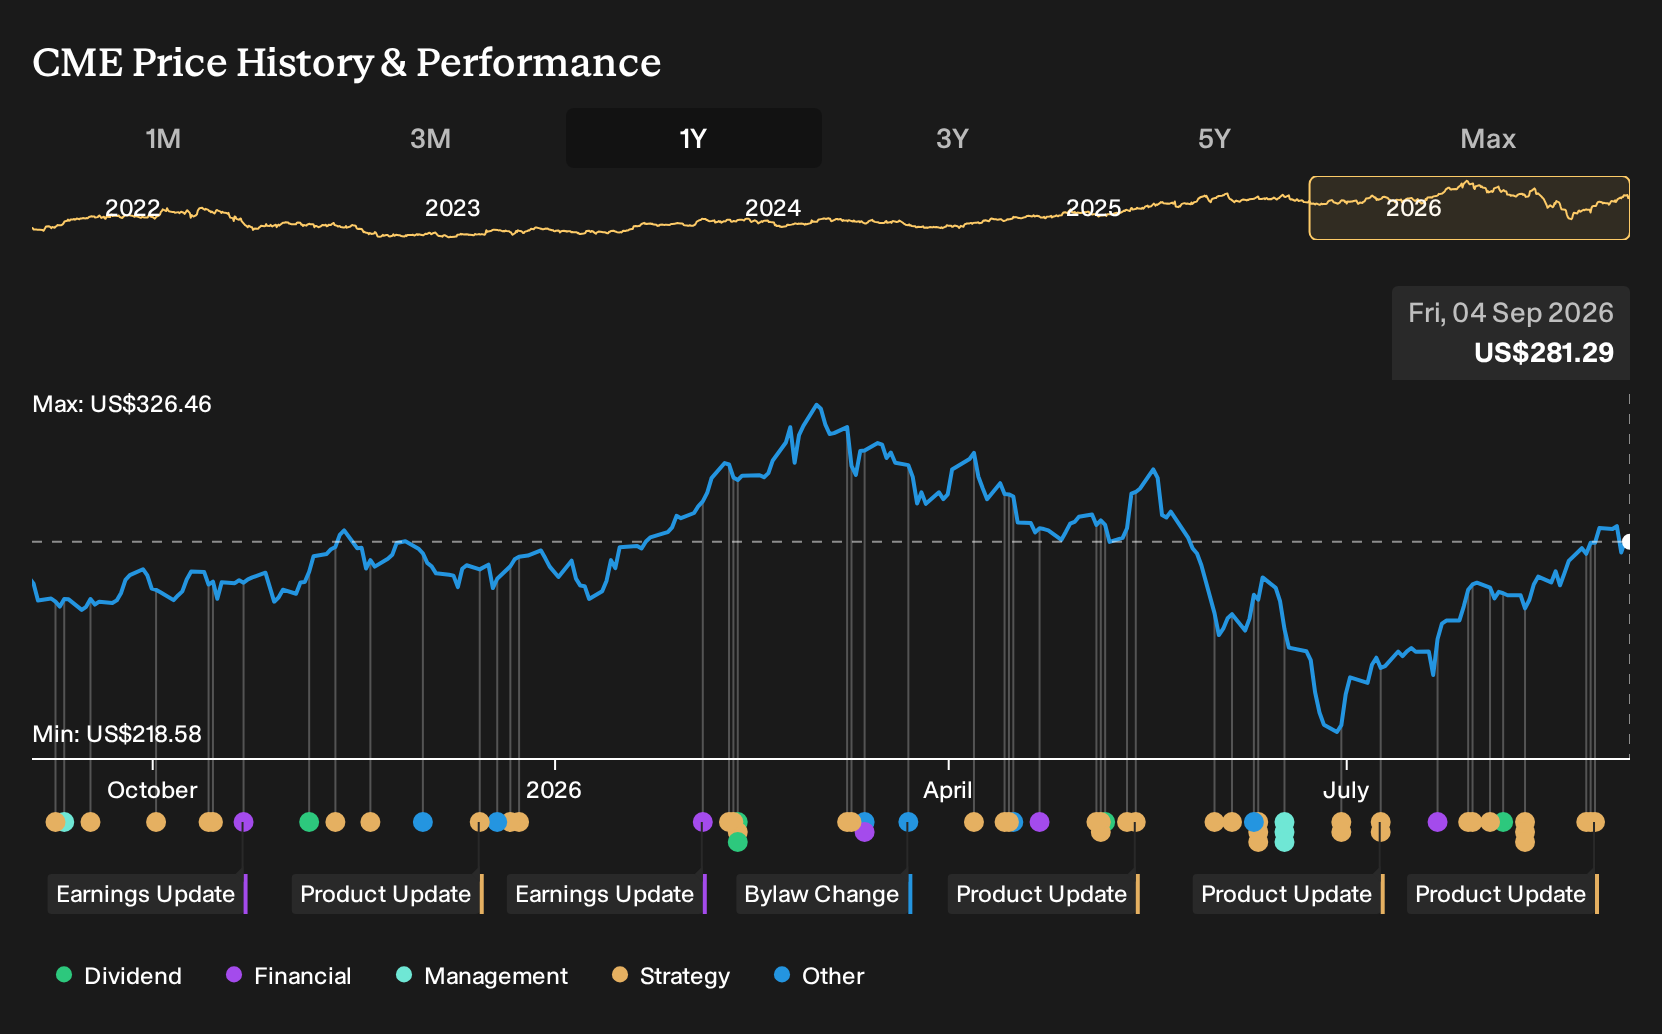
CME Group's forecasts put fair value at $282.36 versus a $281.29 share price, effectively in line with its current price.
Exploring Other Perspectives
Fair value views from the Simply Wall St Community cluster tightly, with three private investors landing between about US$258.83 and US$283.07 per share. That compressed spread contrasts with open questions around new E-mini Equity Factor futures, upcoming Wind Power contracts, and changing volatility, which could all shift how you think about CME Group's long term earnings power. These differing angles show how far opinions can diverge, so it is worth exploring several Community viewpoints before deciding where you stand.
If you want to see how other investors are framing CME Group's value, compare these views with the 2 other fair value estimates for CME Group.
Form Your Own Verdict
Don't just follow the ticker; dig into the data and build a conviction that's truly your own.
- A great starting point for your CME Group research is our analysis highlighting 2 key rewards and 1 important warning sign that could impact your investment decision.
- See our latest analysis for CME Group. The report includes a comprehensive fundamental analysis summarized in a single visual, the Snowflake, making it easy to evaluate CME Group's overall financial health at a glance.
Looking For More CME Group Style Ideas?
If CME Group has you thinking about where volume, pricing power, and balance sheet strength intersect, it can help to scan for other businesses that fit clear financial filters rather than chasing headlines.
- If you like the idea of paying less for solid cash flows, start with a tight list of quality-first candidates using the 49 high quality undervalued stocks.
- If capital preservation matters more than rapid swings, filter for sturdier balance sheets and steadier fundamentals with the list of solid balance sheet and fundamentals (24 results).
- If income is your priority, focus on companies that aim to combine higher yields with resilience by running a screen across the 6 dividend fortresses.
This article by Simply Wall St is general in nature. We provide commentary based on historical data and analyst forecasts only using an unbiased methodology and our articles are not intended to be financial advice. It does not constitute a recommendation to buy or sell any stock, and does not take account of your objectives, or your financial situation. We aim to bring you long-term focused analysis driven by fundamental data. Note that our analysis may not factor in the latest price-sensitive company announcements or qualitative material. Simply Wall St has no position in any stocks mentioned.
Have feedback on this article? Concerned about the content? Get in touch with us directly. Alternatively, email editorial-team@simplywallst.com