


Is Burkhalter Holding (SWX:BRKN) Undervalued Following Firmer Half Year Earnings And 2026 Guidance?
Burkhalter Holding guidance puts earnings trajectory in focus
Burkhalter Holding (SWX:BRKN) has reported firmer half-year figures and reaffirmed its outlook for 2026, with management still anticipating a moderate earnings per share increase compared with 2025.
Recent trading has been mixed for Burkhalter Holding, with the share price at CHF133.2 after a 1-day gain of 1.83%, a 7-day share price return of 1.52%, but a 90-day share price decline of 17.47%. This contrasts with a 5-year total shareholder return of 143.25%, indicating that long-term holders have still seen strong value creation even as near-term momentum has eased around the latest earnings update and 2026 guidance.
Scan list of solid balance sheet and fundamentals (194 results) to see how Burkhalter Holding compares with other infrastructure and construction specialists that pair earnings resilience with a sturdy financial footing.
Recent weakness in Burkhalter Holding despite firmer earnings and steady 2026 guidance raises a simple question. Is the share price now tracking the business, or just swinging with sentiment as investors reassess valuation?
Price-to-Earnings of 23.1x: Is it justified?
On recent figures, Burkhalter Holding trades on a P/E of 23.1x, which puts the CHF133.2 share price at a richer earnings multiple than several peers.
The P/E ratio compares what investors are paying for each unit of earnings. For a construction and infrastructure services group like Burkhalter Holding, that metric often reflects how durable the profit stream looks and how confident the market is that earnings will continue on their current track.
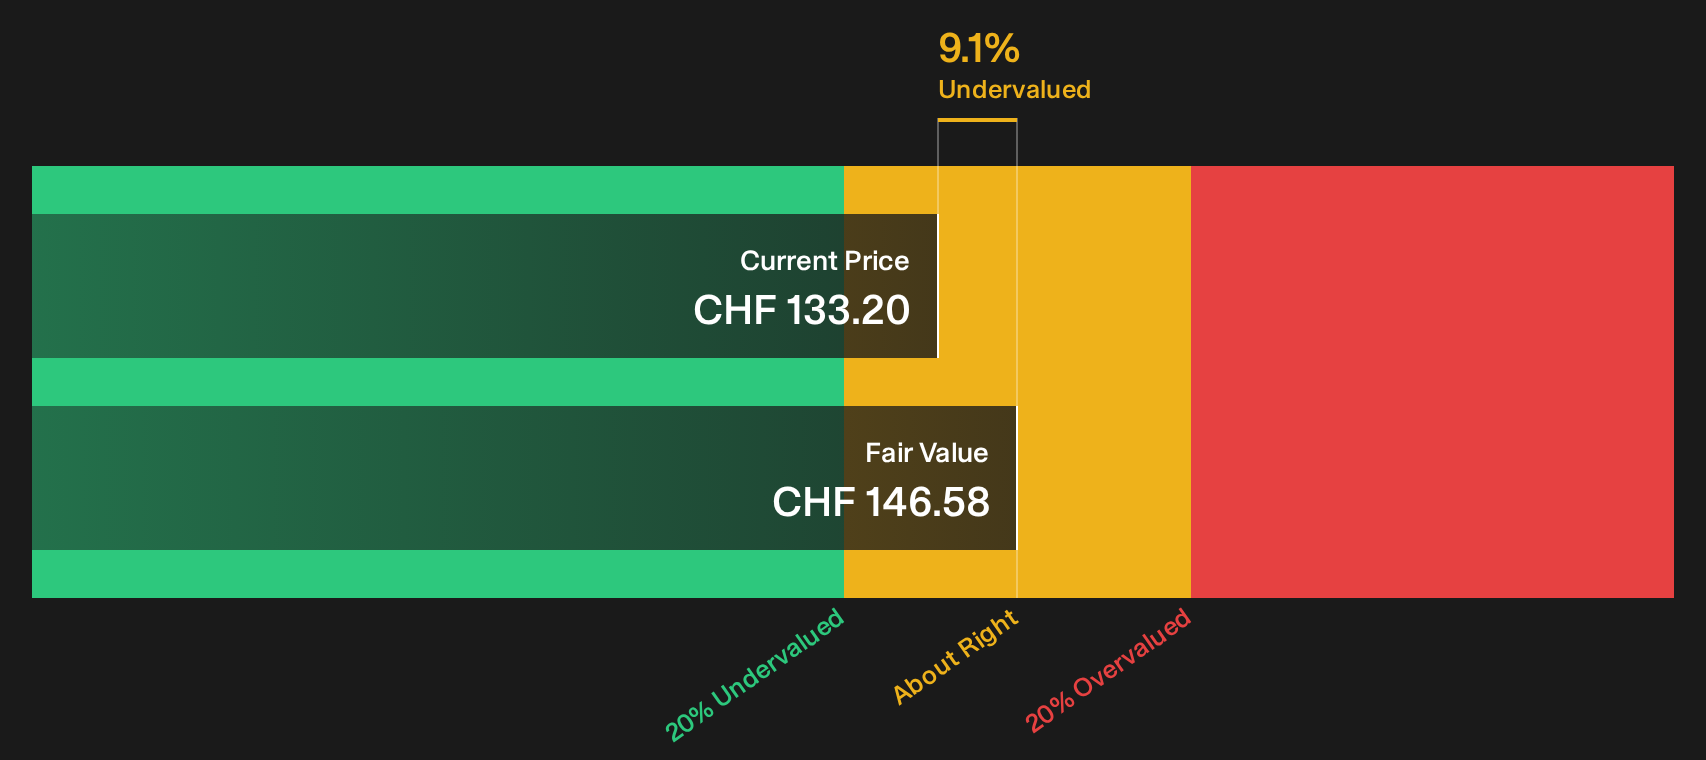
Analysts using the SWS DCF model estimate that Burkhalter Holding shares are trading about 9.1% below their future cash flow value, at CHF133.2 versus an implied CHF146.58. That suggests the market price is not fully aligned with the future cash flow estimate, even though the current P/E is above the SWS fair P/E ratio of 18.3x. The stock also trades on a higher multiple than the wider European Construction industry at 15.3x, but a lower P/E than its direct peer group average of 31.2x, which points to a valuation level that could shift if sentiment moves closer to the fair ratio.
For investors who want to understand this fair ratio framework in more depth, Explore the SWS fair ratio for Burkhalter Holding
Result: Price-to-Earnings of 23.1x (OVERVALUED)
Still, any slowdown in Switzerland’s construction activity or pressure on Burkhalter Holding’s margins from tighter project pricing could quickly test confidence in that 23.1x P/E.
Find out about the key risks to this Burkhalter Holding narrative.
Another view on Burkhalter Holding’s value
The first lens on Burkhalter Holding focused on its 23.1x P/E, which screens as rich against both the European Construction sector and the SWS fair ratio. The SWS DCF model points in a different direction. At CHF133.2 versus an estimated CHF146.58 future cash flow value, the shares screen as about 9.1% undervalued.
That kind of gap is not huge, yet it suggests the market is pricing Burkhalter Holding a little more cautiously than the cash flow model implies. The question for investors is simple. Does the earnings multiple prove right, or does the cash flow view end up closer to reality over time.
Look into how the SWS DCF model arrives at its fair value.
Simply Wall St performs a discounted cash flow (DCF) on every stock in the world every day (check out Burkhalter Holding for example). We show the entire calculation in full. You can track the result in your watchlist or portfolio and be alerted when this changes, or use our stock screener to discover 256 high quality undervalued stocks. If you save a screener we even alert you when new companies match - so you never miss a potential opportunity.
Next Steps
Mixed signals around Burkhalter Holding’s valuation and guidance only matter if you put them in your own context. Move quickly, review both the upside and the downside in detail, and use the 3 key rewards and 1 important warning sign to pressure test your conclusion.
Looking for more Burkhalter Holding sized ideas?
Do not stop at Burkhalter Holding. Use the same disciplined lens across other opportunities so you are not relying on a single story or sector.
- Target quality at a discount and scan 256 high quality undervalued stocks that combine strong fundamentals with prices that sit below their assessed worth.
- Prioritise resilience and review the 311 resilient stocks with low risk scores that pair sturdier balance sheets with more measured risk profiles.
- Hunt for tomorrow's leaders early and check the 617 high quality undiscovered gems before attention and pricing fully catch up.
This article by Simply Wall St is general in nature. We provide commentary based on historical data and analyst forecasts only using an unbiased methodology and our articles are not intended to be financial advice. It does not constitute a recommendation to buy or sell any stock, and does not take account of your objectives, or your financial situation. We aim to bring you long-term focused analysis driven by fundamental data. Note that our analysis may not factor in the latest price-sensitive company announcements or qualitative material. Simply Wall St has no position in any stocks mentioned.
Have feedback on this article? Concerned about the content? Get in touch with us directly. Alternatively, email editorial-team@simplywallst.com