


Is Keystone Infra (TASE:KSTN) A Bargain As Earnings Decline?
Keystone Infra (TASE:KSTN) recently reported second quarter and first half 2026 earnings, with revenue and net income for both periods lower than the same time last year. This has drawn fresh attention to the stock.
Despite the weaker first half, Keystone Infra’s share price has been resilient, with a 7 day share price return of 5.02% and a year to date share price return of 117.26%. The 1 year total shareholder return of 128.66% points to strong longer term momentum building around the stock.
Compare Keystone Infra’s recent surge with other stocks showing strong price momentum and financial resilience using the curated 308 resilient stocks with low risk scores.
With Keystone Infra’s earnings under pressure yet the share price sharply higher this year, the key tension now is clear: Is most of the rerating already behind the stock, or does the current valuation still leave meaningful upside ahead?
Price-to-Earnings of 5.4x: Is it justified?
On the numbers available, Keystone Infra looks inexpensive compared to peers, with a P/E of 5.4x while the stock trades at ₪21.53 and sits slightly below an internal fair value estimate. That combination of a low earnings multiple and a share price close to a discounted cash flow estimate is what many investors are now trying to interpret.
The P/E ratio shows how much investors are paying today for each unit of current earnings. For an asset management and custody company like Keystone Infra, which reports earnings of ₪814.278m on revenue of ₪1,119.044m and a Return on Equity of 26.1%, this measure gives a quick sense of how the market is pricing those profits.
According to the data, Keystone Infra is described as good value on this basis. The P/E of 5.4x is framed as attractive relative to earnings quality, with profit margins of 72.8% and a history of earnings growth. This indicates that the current share price may not fully reflect the level of profitability currently being reported, although investors will still need to form a view on how sustainable these metrics are.
The comparison with peers is clear. Keystone Infra is described as good value against both its immediate peer group average P/E of 16.5x and the broader Asian Capital Markets industry average of 15.6x. That is a wide gap, and if earnings remain at similar levels, the multiple difference would indicate the market is pricing Keystone Infra at a sizeable discount to comparable companies.
See what the numbers say about this price — find out in our valuation breakdown.
Result: Price-to-Earnings of 5.4x (UNDERVALUED)
However, investors still face clear risks if Keystone Infra’s earnings weaken further or if sentiment toward Israel-based financial stocks cools after the recent surge.
Find out about the key risks to this Keystone Infra narrative.
Another view on Keystone Infra using our DCF model
The P/E points to Keystone Infra looking inexpensive, yet our DCF model paints a slightly different picture. With the stock at ₪21.53 compared with an internal future cash flow value estimate of ₪22.63, Keystone Infra screens as modestly undervalued rather than deeply mispriced. How much weight do you give to that smaller discount?
Look into how the SWS DCF model arrives at its fair value.
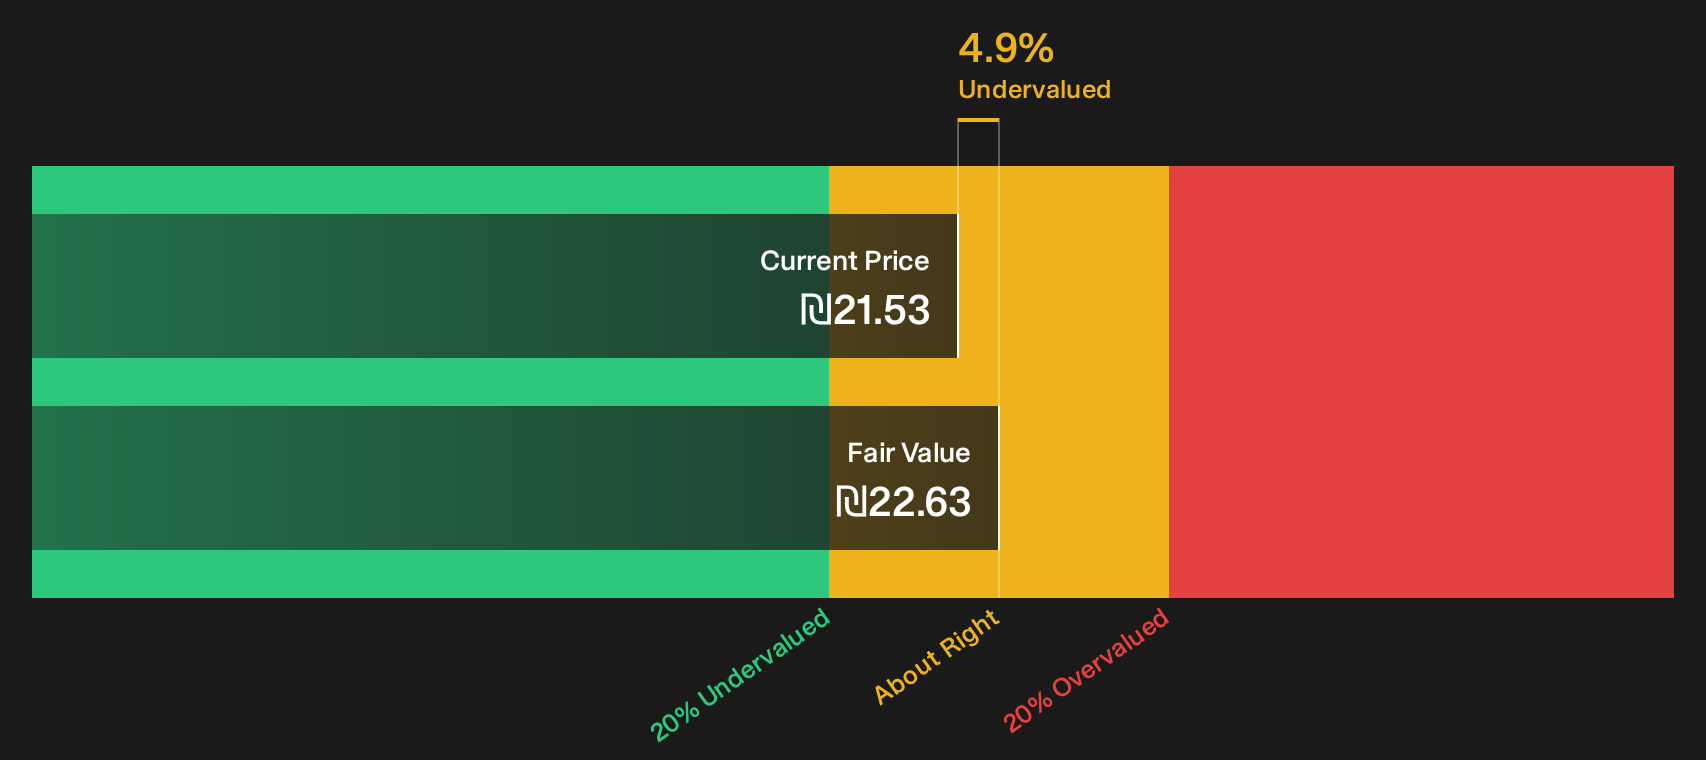
Simply Wall St performs a discounted cash flow (DCF) on every stock in the world every day (check out Keystone Infra for example). We show the entire calculation in full. You can track the result in your watchlist or portfolio and be alerted when this changes, or use our stock screener to discover 258 high quality undervalued stocks. If you save a screener we even alert you when new companies match - so you never miss a potential opportunity.
Next Steps
With mixed signals around Keystone Infra, it helps to weigh the enthusiasm against the concerns using the same numbers. If you want a clearer sense of the balance between potential risks and rewards here, start by checking the 2 key rewards and 1 important warning sign.
Looking for more investment ideas beyond Keystone Infra?
If Keystone Infra has caught your attention, do not stop there. Use these curated ideas to quickly find other stocks that match the kind of opportunities you care about.
- Target potential mispricings by scanning companies that combine quality fundamentals with appealing valuations through the 258 high quality undervalued stocks.
- Strengthen your income stream by hunting for companies that offer robust yields and balance sheet support using the 420 dividend fortresses.
- Prioritise resilience by filtering for companies with sturdy financial footing and healthy fundamentals via the list of solid balance sheet and fundamentals (439 results).
This article by Simply Wall St is general in nature. We provide commentary based on historical data and analyst forecasts only using an unbiased methodology and our articles are not intended to be financial advice. It does not constitute a recommendation to buy or sell any stock, and does not take account of your objectives, or your financial situation. We aim to bring you long-term focused analysis driven by fundamental data. Note that our analysis may not factor in the latest price-sensitive company announcements or qualitative material. Simply Wall St has no position in any stocks mentioned.
Have feedback on this article? Concerned about the content? Get in touch with us directly. Alternatively, email editorial-team@simplywallst.com