


Global Dividend Stocks To Watch In August 2026
As global markets navigate a landscape marked by elevated Treasury yields, geopolitical tensions, and fluctuating oil prices, investors are increasingly seeking stability in dividend stocks. In this environment of economic uncertainty and mixed market performance, dividend-paying stocks can offer a reliable income stream while potentially providing some cushion against volatility.
Top 10 Dividend Stocks Globally
| Name | Dividend Yield | Dividend Rating |
| Telekom Austria (WBAG:TKA) | 4.16% | ★★★★★★ |
| SIGMAXYZ Holdings (TSE:6088) | 4.69% | ★★★★★★ |
| Sakai Moving ServiceLtd (TSE:9039) | 3.89% | ★★★★★★ |
| OUG Holdings (TSE:8041) | 3.75% | ★★★★★★ |
| Nippon Carbon (TSE:5302) | 4.10% | ★★★★★★ |
| NCD (TSE:4783) | 4.54% | ★★★★★★ |
| Kyoritsu Electric (TSE:6874) | 3.83% | ★★★★★★ |
| Kumagai GumiLtd (TSE:1861) | 3.83% | ★★★★★★ |
| Business Brain Showa-Ota (TSE:9658) | 4.30% | ★★★★★★ |
| 104 (TWSE:3130) | 6.93% | ★★★★★★ |
Click here to see the full list of 1302 stocks from our Top Global Dividend Stocks screener.
Let's review some notable picks from our screened stocks.
Emirates Insurance Company P.J.S.C (ADX:EIC)
Simply Wall St Dividend Rating: ★★★★★★
Overview: Emirates Insurance Company P.J.S.C. operates by providing general insurance and reinsurance services in the United Arab Emirates, the United States, and Europe, with a market cap of AED1.21 billion.
Operations: Emirates Insurance Company P.J.S.C. generates its revenue primarily from underwriting, amounting to AED1.87 billion, and investments, contributing AED94.76 million.
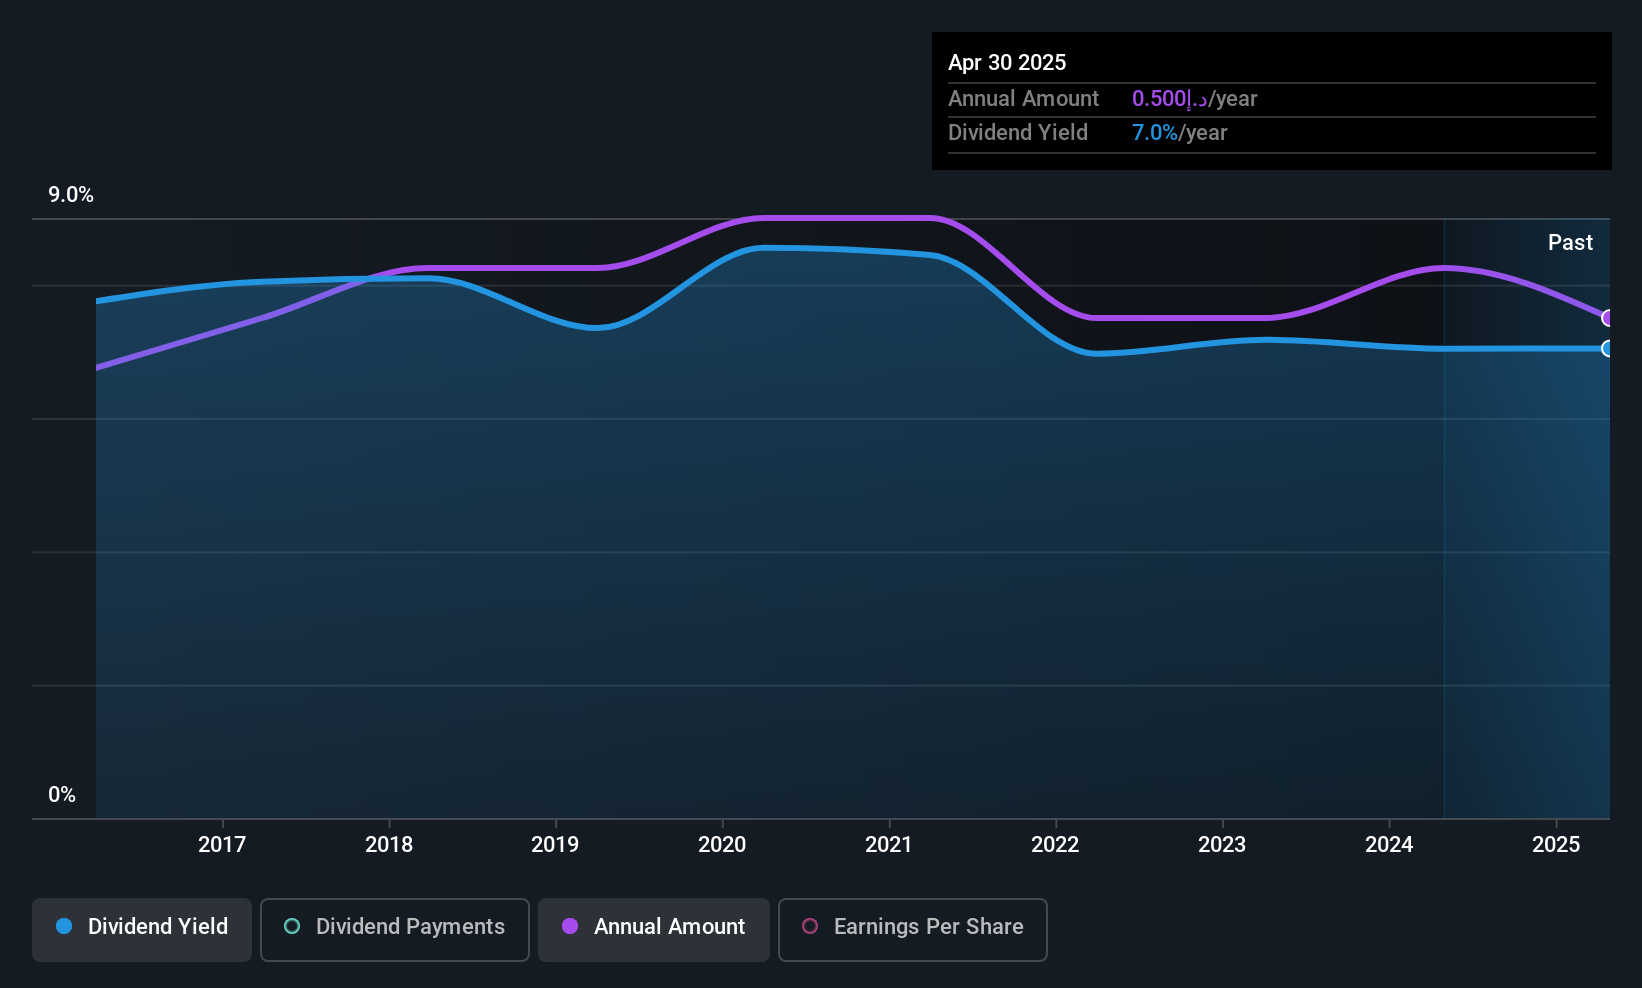
Dividend Yield: 7.4%
Emirates Insurance Company P.J.S.C. offers a compelling dividend profile with stable and growing dividends over the past decade, supported by a reasonable payout ratio of 62.2% and robust cash flow coverage at 41.8%. Its dividend yield of 7.42% ranks in the top 25% of AE market payers, reflecting its attractive valuation with a price-to-earnings ratio below the market average. Recent earnings growth further solidifies its capacity to maintain reliable dividend distributions.
- Get an in-depth perspective on Emirates Insurance Company P.J.S.C's performance by reading our dividend report here.
- The valuation report we've compiled suggests that Emirates Insurance Company P.J.S.C's current price could be inflated.
Nishikawa Rubber (TSE:5161)
Simply Wall St Dividend Rating: ★★★★☆☆
Overview: Nishikawa Rubber Co., Ltd. manufactures and sells rubber and sealing products both in Japan and internationally, with a market cap of ¥131.24 billion.
Operations: Nishikawa Rubber Co., Ltd. generates revenue through its manufacturing and sale of rubber and sealing products across domestic and international markets.
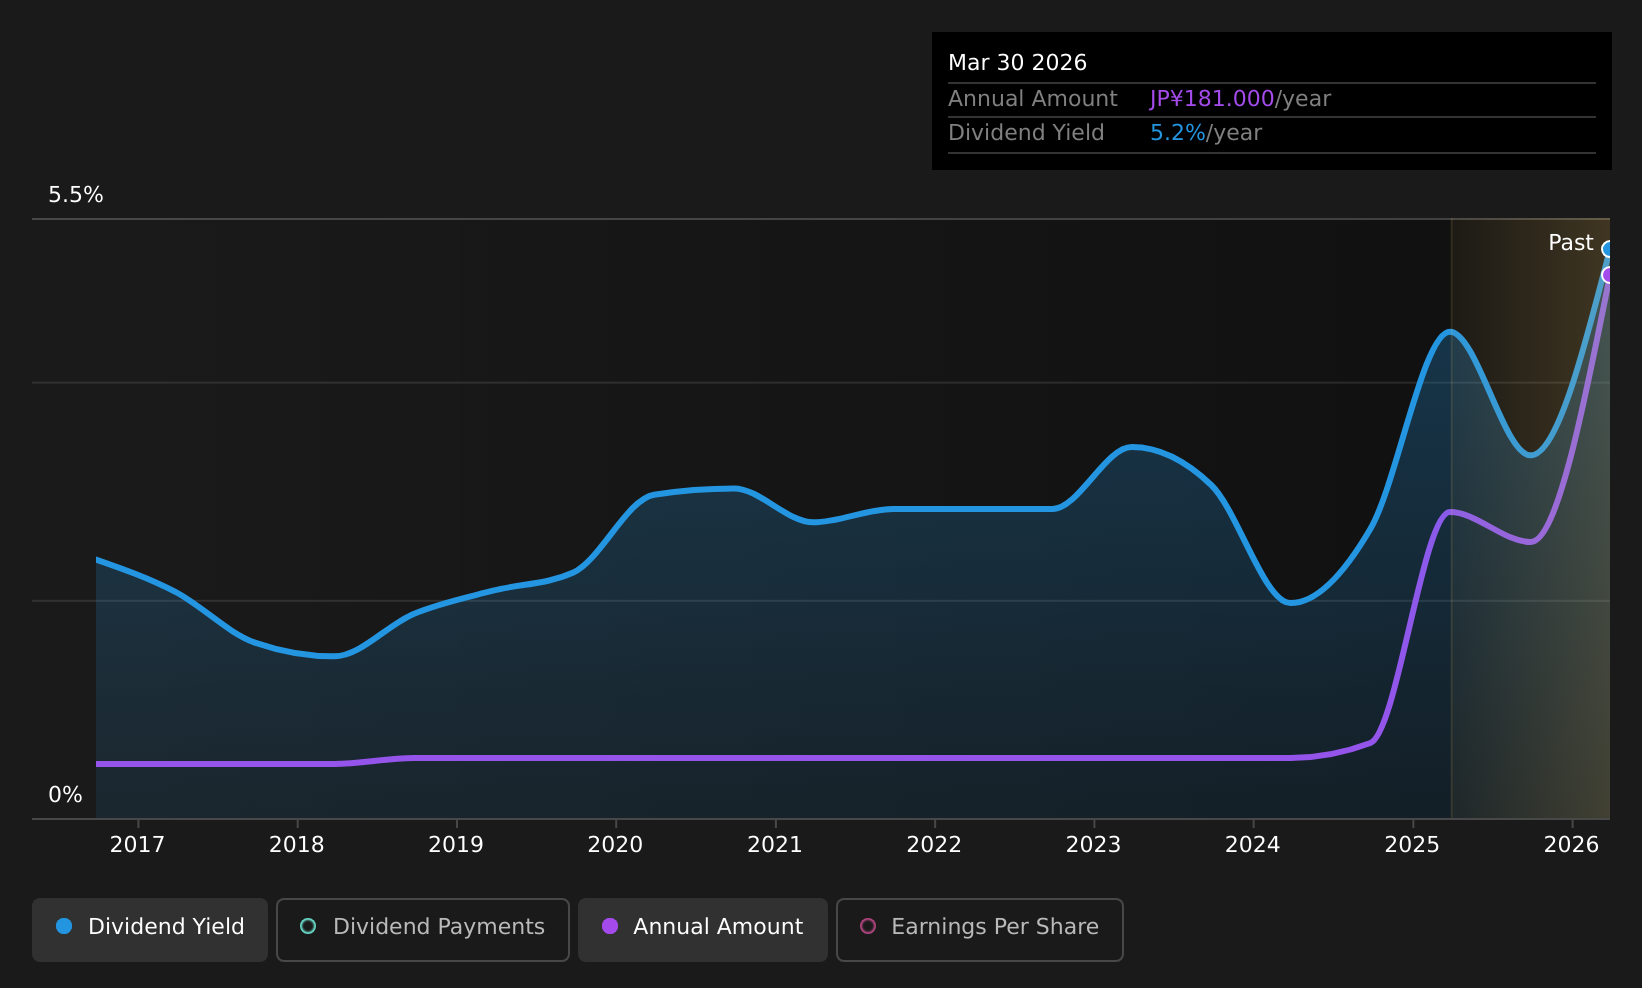
Dividend Yield: 5%
Nishikawa Rubber's dividend yield of 4.97% places it among the top 25% in the Japanese market, yet its dividends have been volatile and unreliable over the past decade. Despite a reasonable payout ratio of 58.7%, cash flow coverage is weak with a high cash payout ratio of 99.4%. While earnings saw significant growth recently, dividends are not well covered by free cash flows, raising concerns about sustainability.
- Take a closer look at Nishikawa Rubber's potential here in our dividend report.
- Our valuation report here indicates Nishikawa Rubber may be overvalued.
Nippon Seiki (TSE:7287)
Simply Wall St Dividend Rating: ★★★★★☆
Overview: Nippon Seiki Co., Ltd. manufactures and sells automotive, motorcycle, and consumer electronics instruments, as well as resin materials and automobiles across Japan, the Americas, Europe, and Asia with a market cap of ¥149.11 billion.
Operations: Nippon Seiki Co., Ltd.'s revenue segments include the Automotive Business generating ¥273.05 billion and the Consumer Business contributing ¥13.99 billion.
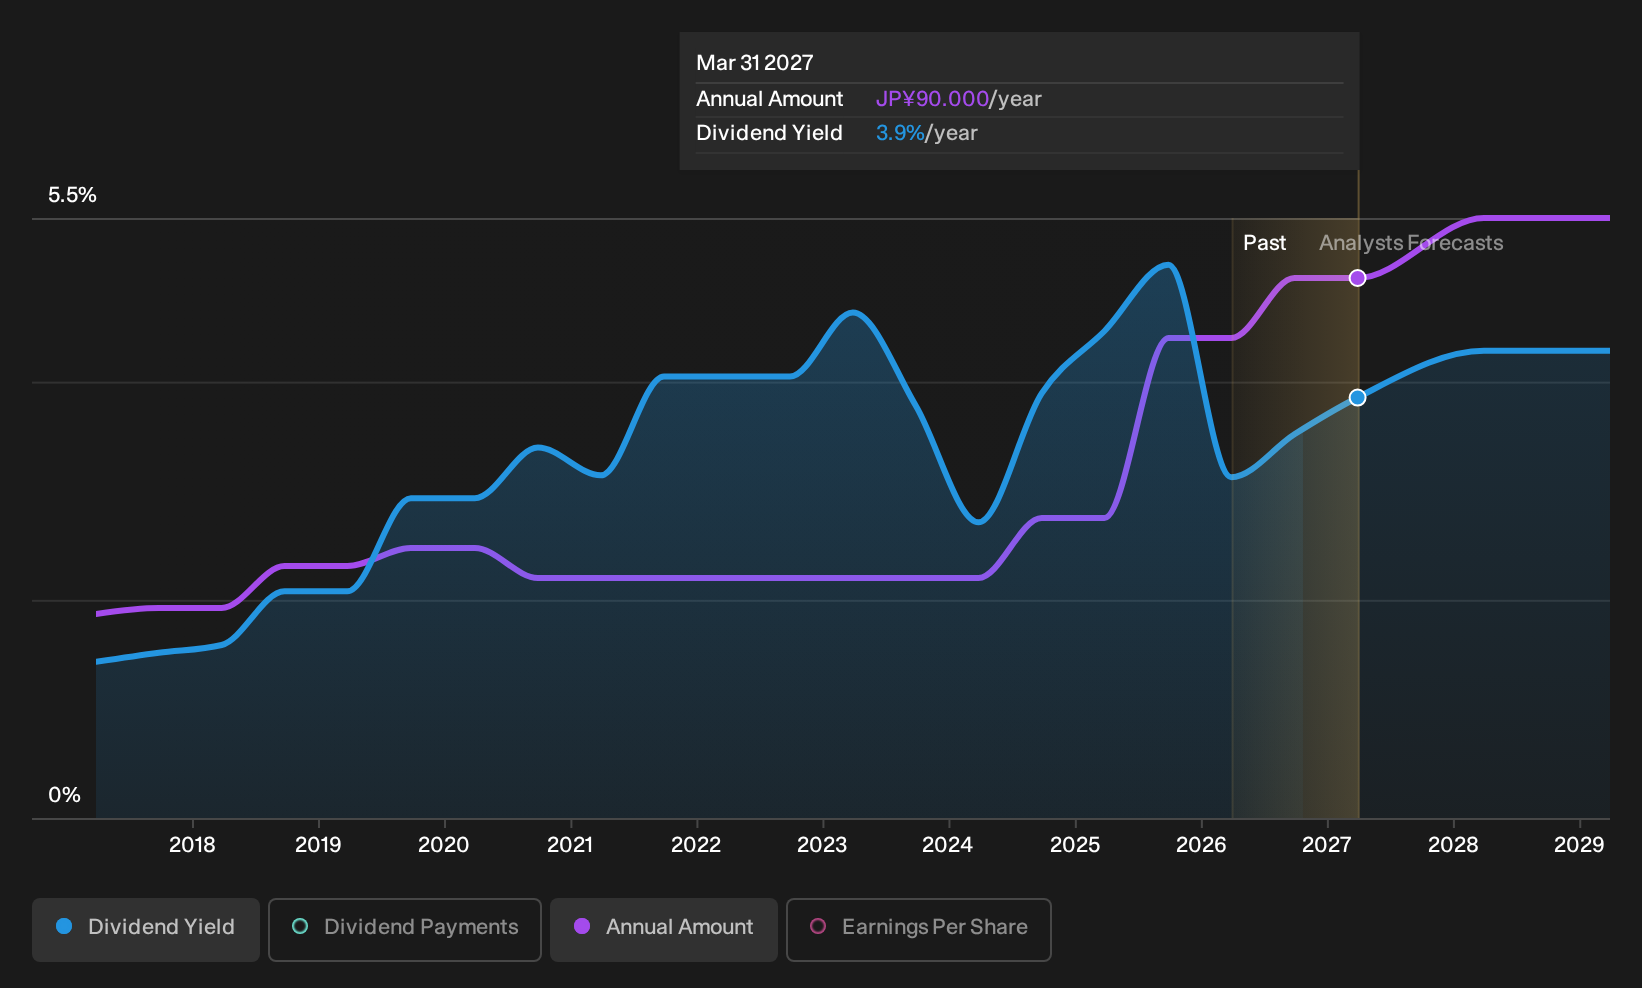
Dividend Yield: 3.3%
Nippon Seiki's dividend profile is supported by stable and growing payments over the past decade, with dividends well covered by both earnings (payout ratio: 50.8%) and cash flows (cash payout ratio: 25%). Despite a lower yield of 3.3% compared to top-tier Japanese dividend payers, its financial health is underscored by recent strong earnings growth—net income nearly doubled year-over-year in Q1 2026, reflecting robust operational performance.
- Navigate through the intricacies of Nippon Seiki with our comprehensive dividend report here.
- Insights from our recent valuation report point to the potential overvaluation of Nippon Seiki shares in the market.
Turning Ideas Into Actions
- Get an in-depth perspective on all 1302 Top Global Dividend Stocks by using our screener here.
- Already own these companies? Bring clarity to your investment decisions by linking up your portfolio with Simply Wall St, where you can monitor all the vital signs of your stocks effortlessly.
- Simply Wall St is your key to unlocking global market trends, a free user-friendly app for forward-thinking investors.
Ready To Venture Into Other Investment Styles?
- Explore high-performing small cap companies that haven't yet garnered significant analyst attention.
- Fuel your portfolio with companies showing strong growth potential, backed by optimistic outlooks both from analysts and management.
- Find companies with promising cash flow potential yet trading below their fair value.
This article by Simply Wall St is general in nature. We provide commentary based on historical data and analyst forecasts only using an unbiased methodology and our articles are not intended to be financial advice. It does not constitute a recommendation to buy or sell any stock, and does not take account of your objectives, or your financial situation. We aim to bring you long-term focused analysis driven by fundamental data. Note that our analysis may not factor in the latest price-sensitive company announcements or qualitative material. Simply Wall St has no position in any stocks mentioned.
Have feedback on this article? Concerned about the content? Get in touch with us directly. Alternatively, email editorial-team@simplywallst.com