


StoneX Group (SNEX) After Strong Earnings Is The Undervalued View Too Hard To Ignore
StoneX Group (SNEX) just posted third quarter and nine month results that showed higher revenue and net income than the prior year periods, which is drawing fresh attention to the stock.
See our latest analysis for StoneX Group.
The latest move in StoneX Group’s share price has been mixed, with a 1-day share price return that declined 2.94% but a strong year-to-date share price return of 53.42%, alongside a very large 5-year total shareholder return of 411.57% that points to momentum built over a longer period.
If strong earnings have you rethinking where growth could come from next, it may be worth scanning opportunities across 21 top founder-led companies
Bulls point to StoneX Group’s strong recent results and long term share gains. Bears focus on the mixed near term price move and question how much is already reflected. Which side does the current valuation support?
Most Popular Narrative: 57.2% Undervalued
According to the most followed narrative, StoneX Group’s fair value of $155 sits well above the recent $66.40 close, which creates a wide valuation gap for investors to assess.
The first driver is volatility and hedging demand. StoneX tends to do well when clients need to react to market uncertainty.
Want to see what keeps that fair value well above the current price? The narrative focuses on earnings power, margins and the impact of recent acquisitions. Curious which assumptions really move the model on StoneX Group?
Result: Fair Value of $155 (UNDERVALUED)
Have a read of the narrative in full and understand what's behind the forecasts.
However, StoneX Group’s story could change quickly if volatility, derivatives volumes, or interest income on client balances fall back and recent earnings strength fades.
Find out about the key risks to this StoneX Group narrative.
Another View On StoneX Group’s Valuation
The most followed narrative points to StoneX Group trading well below a $155 fair value. The SWS DCF model tells a very different story. On that view, SNEX at $66.40 sits well above an estimated future cash flow value of $22.08, which implies the stock screens as expensive rather than cheap. Which framework do you think better fits a business whose earnings can be sensitive to volatility, interest income and client activity levels?
Look into how the SWS DCF model arrives at its fair value.
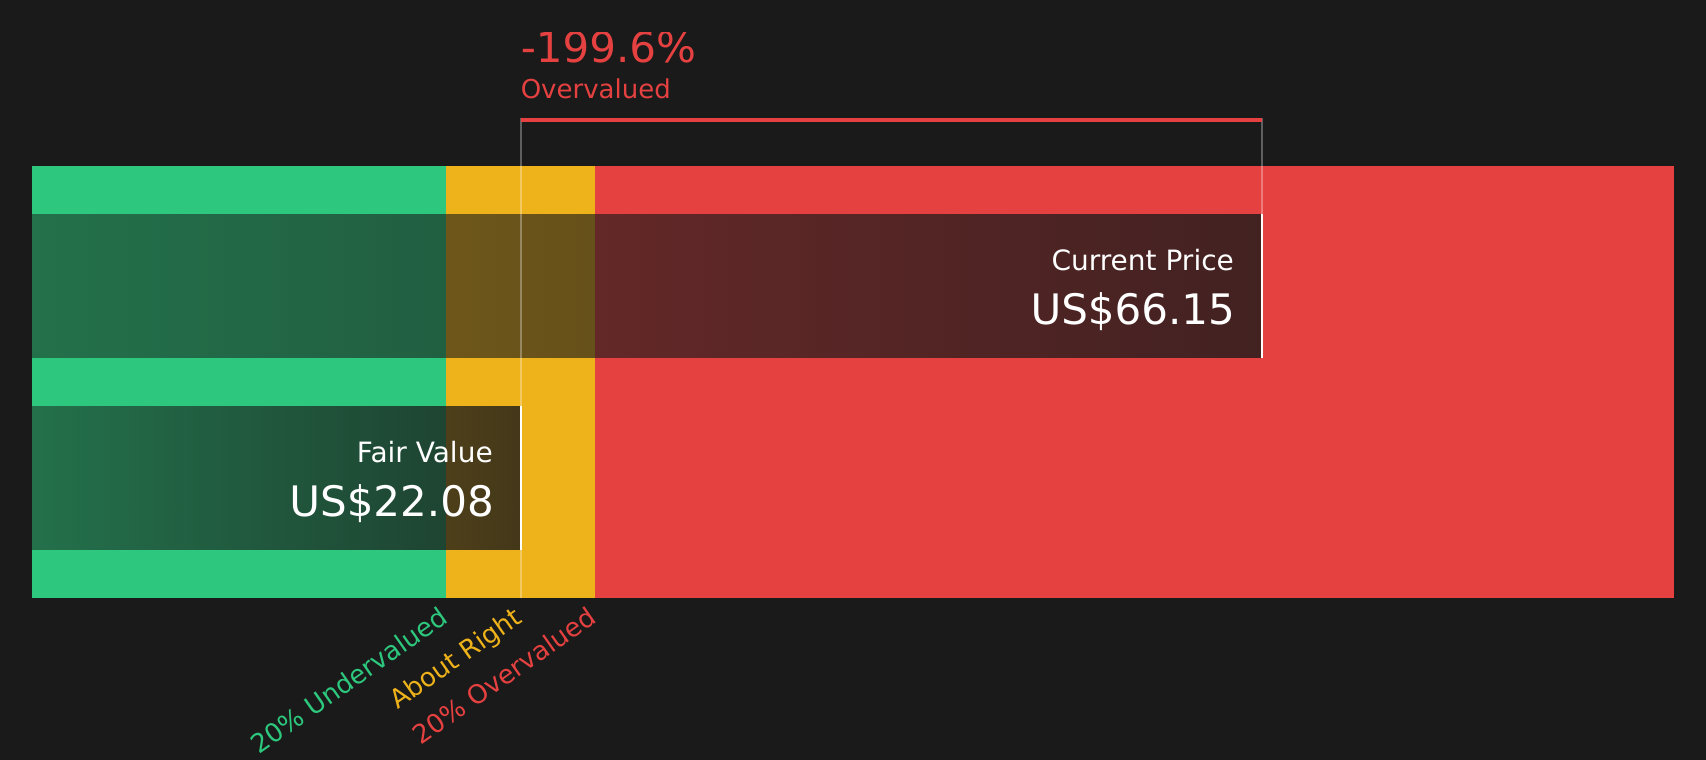
Simply Wall St performs a discounted cash flow (DCF) on every stock in the world every day (check out StoneX Group for example). We show the entire calculation in full. You can track the result in your watchlist or portfolio and be alerted when this changes, or use our stock screener to discover 50 high quality undervalued stocks. If you save a screener we even alert you when new companies match - so you never miss a potential opportunity.
Next Steps
The divide between bullish and cautious views on StoneX Group is clear, so it may be helpful to review the underlying data for yourself, then weigh the 3 key rewards and 1 important warning sign.
Looking for more investment ideas beyond StoneX Group?
If StoneX Group has sharpened your focus on where returns might come from next, do not stop here. Use the screener to quickly surface fresh ideas that match your style.
- Target resilient income by reviewing companies that feature strong payouts through the 11 dividend fortresses.
- Hunt for quality at a potential discount by scanning opportunities in the 50 high quality undervalued stocks.
- Prioritise resilience and capital preservation by filtering stocks with the 79 resilient stocks with low risk scores.
This article by Simply Wall St is general in nature. We provide commentary based on historical data and analyst forecasts only using an unbiased methodology and our articles are not intended to be financial advice. It does not constitute a recommendation to buy or sell any stock, and does not take account of your objectives, or your financial situation. We aim to bring you long-term focused analysis driven by fundamental data. Note that our analysis may not factor in the latest price-sensitive company announcements or qualitative material. Simply Wall St has no position in any stocks mentioned.
Have feedback on this article? Concerned about the content? Get in touch with us directly. Alternatively, email editorial-team@simplywallst.com