


European Value Stock Estimates For August 2026
As European markets navigate geopolitical uncertainties and fluctuating energy prices, the pan-European STOXX Europe 600 Index recently experienced a slight decline. However, resilient economic data and solid corporate earnings provide a foundation for identifying undervalued stocks that may offer potential value opportunities in this complex landscape.
Top 10 Undervalued Stocks Based On Cash Flows In Europe
| Name | Current Price | Fair Value (Est) | Discount (Est) |
| thyssenkrupp nucera KGaA (XTRA:NCH2) | €7.80 | €15.54 | 49.8% |
| Tecan Group (SWX:TECN) | CHF189.10 | CHF371.77 | 49.1% |
| Stille (OM:STIL) | SEK233.50 | SEK463.37 | 49.6% |
| Nemetschek (XTRA:NEM) | €62.45 | €123.43 | 49.4% |
| Mare Group (BIT:MARE) | €4.98 | €9.92 | 49.8% |
| F-Secure Oyj (HLSE:FSECURE) | €1.974 | €3.95 | 50% |
| DEUTZ (XTRA:DEZ) | €10.15 | €19.99 | 49.2% |
| Casta Diva Group (BIT:CDG) | €3.06 | €6.09 | 49.7% |
| Borregaard (OB:BRG) | NOK156.40 | NOK309.04 | 49.4% |
| Bonesupport Holding (OM:BONEX) | SEK223.60 | SEK442.17 | 49.4% |
Below we spotlight a couple of our favorites from our exclusive screener.
Kinepolis Group (ENXTBR:KIN)
Overview: Kinepolis Group NV operates and manages cinemas across Belgium, Canada, France, the Netherlands, the United States, Spain, Luxembourg, and Switzerland with a market cap of €1.12 billion.
Operations: The company's revenue segments include Box Office (€290.74 million), In-Theatre Sales (€179.73 million), Business-To-Business (€64.81 million), Real Estate (€14.86 million), Brightfish (€11.06 million), and Film Distribution (€3.70 million).
Estimated Discount To Fair Value: 16%
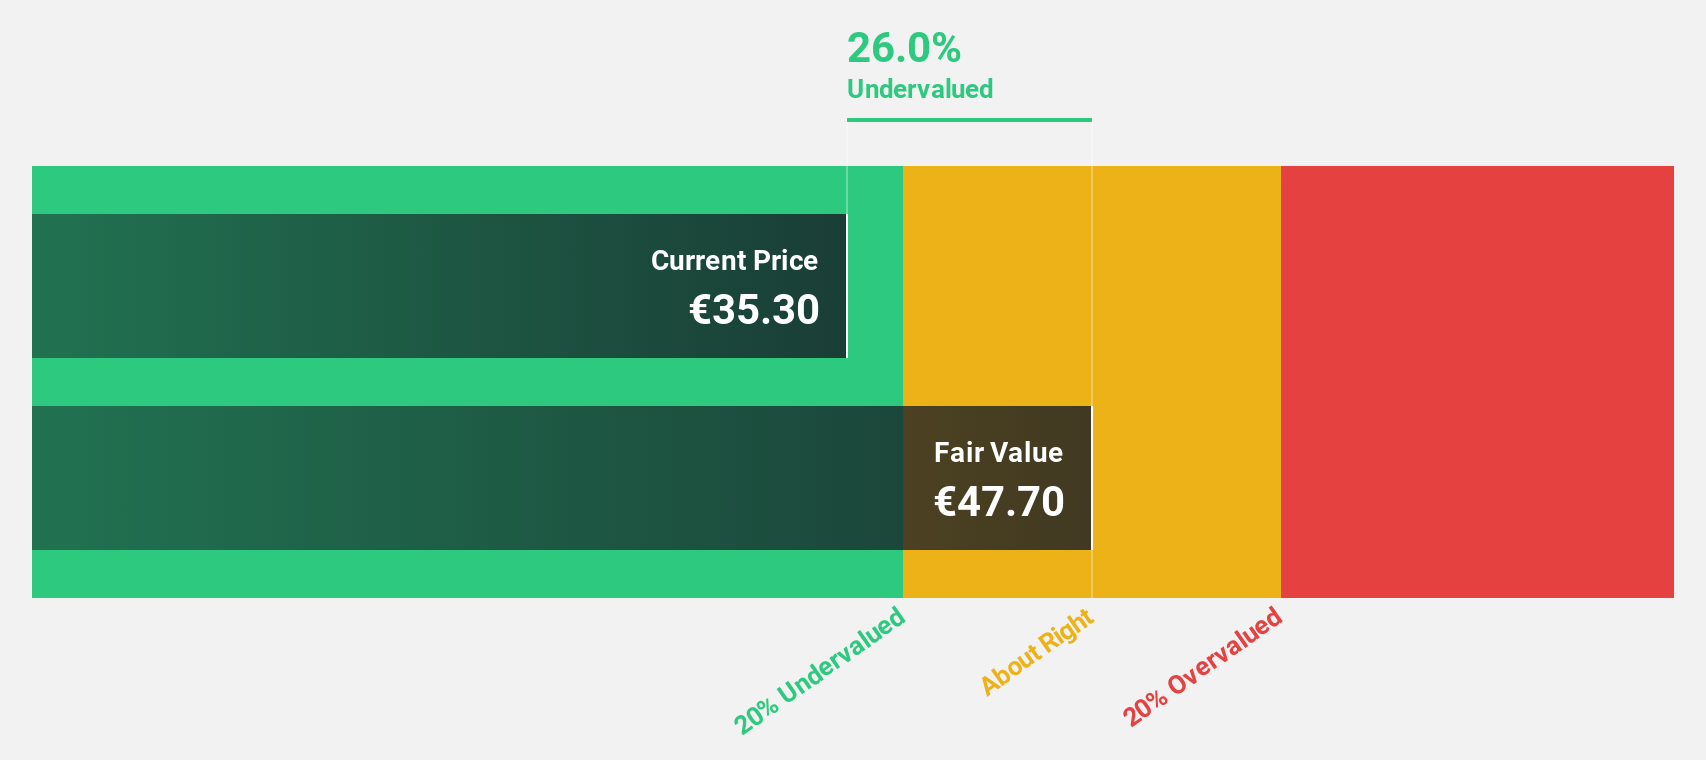
Kinepolis Group, trading at €41.70, is approximately 16% below its estimated future cash flow value of €49.62, indicating potential undervaluation based on cash flows. Despite a high debt level, the company shows promising financial health with earnings expected to grow significantly at 24.1% annually over the next three years, outpacing both revenue growth and the Belgian market average. A recent partnership with Pixelworks aims to enhance its premium screen offerings further supporting its growth trajectory.
- Our expertly prepared growth report on Kinepolis Group implies its future financial outlook may be stronger than recent results.
- Unlock comprehensive insights into our analysis of Kinepolis Group stock in this financial health report.
Apotea (OM:APOTEA)
Overview: Apotea AB (publ) operates an online pharmacy in Sweden with a market cap of SEK7.63 billion.
Operations: The company generates revenue primarily through its online retail operations, amounting to SEK7.59 billion.
Estimated Discount To Fair Value: 38.9%
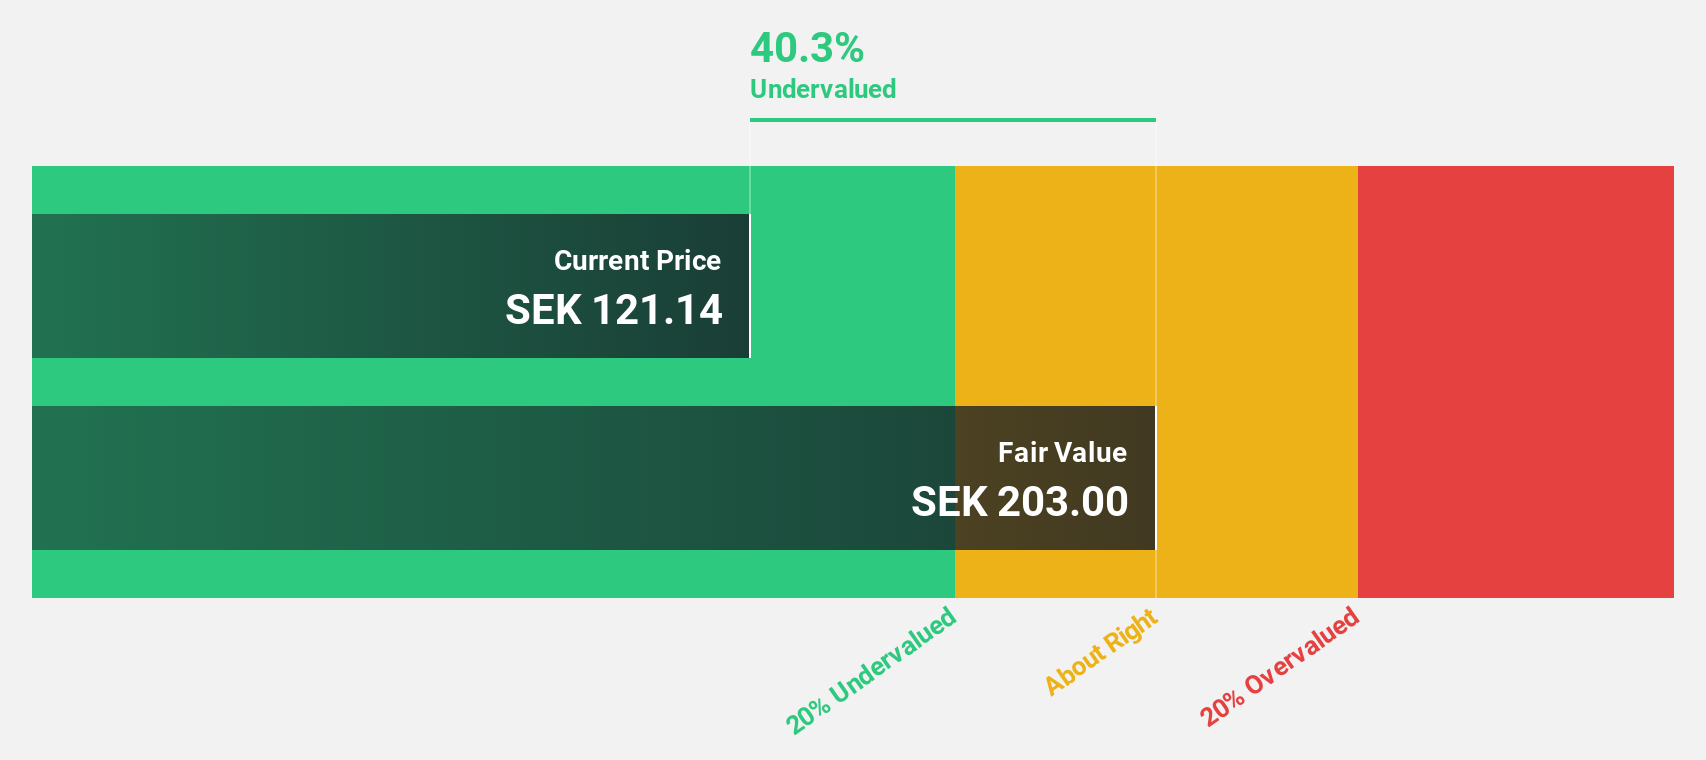
Apotea, trading at SEK 73.3, is significantly undervalued, with a future cash flow value estimated at SEK 119.9. The company's earnings are projected to grow substantially at 22% annually, outpacing the Swedish market's average growth rate of 7.3%. Recent earnings reports show steady improvement in net income and revenue for Q2 and the first half of 2026, indicating robust financial performance despite moderate revenue growth forecasts of 11.6% per year.
- Our growth report here indicates Apotea may be poised for an improving outlook.
- Get an in-depth perspective on Apotea's balance sheet by reading our health report here.
KB Components (OM:KBC)
Overview: KB Components AB (publ) is a Swedish company that designs, develops, manufactures, and sells polymer components for various sectors including automotive, medical technology, and general industry, with a market capitalization of SEK2.50 billion.
Operations: KB Components generates revenue from several regions, with SEK1.37 billion from Europe, SEK1.16 billion from North America, and SEK189.32 million from Asia.
Estimated Discount To Fair Value: 45.9%
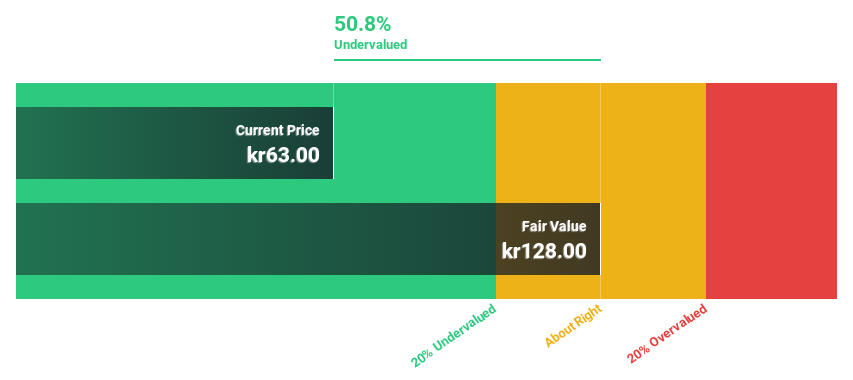
KB Components is trading at SEK 44.6, well below its estimated future cash flow value of SEK 82.37, highlighting significant undervaluation. Despite a challenging year with reduced net income and profit margins, earnings are forecast to grow significantly at 32.2% annually, outpacing the Swedish market average of 7.3%. However, the dividend yield of 3.36% is not adequately covered by earnings or free cash flows, and interest payments are poorly covered by earnings despite expected revenue growth of 8.4% per year.
- In light of our recent growth report, it seems possible that KB Components' financial performance will exceed current levels.
- Take a closer look at KB Components' balance sheet health here in our report.
Where To Now?
- Embark on your investment journey to our 225 Undervalued European Stocks Based On Cash Flows selection here.
- Already own these companies? Link your portfolio to Simply Wall St and get alerts on any new warning signs to your stocks.
- Maximize your investment potential with Simply Wall St, the comprehensive app that offers global market insights for free.
Interested In Other Possibilities?
- Explore high-performing small cap companies that haven't yet garnered significant analyst attention.
- Diversify your portfolio with solid dividend payers offering reliable income streams to weather potential market turbulence.
- Fuel your portfolio with companies showing strong growth potential, backed by optimistic outlooks both from analysts and management.
This article by Simply Wall St is general in nature. We provide commentary based on historical data and analyst forecasts only using an unbiased methodology and our articles are not intended to be financial advice. It does not constitute a recommendation to buy or sell any stock, and does not take account of your objectives, or your financial situation. We aim to bring you long-term focused analysis driven by fundamental data. Note that our analysis may not factor in the latest price-sensitive company announcements or qualitative material. Simply Wall St has no position in any stocks mentioned.
Have feedback on this article? Concerned about the content? Get in touch with us directly. Alternatively, email editorial-team@simplywallst.com