


Is SBS Holdings (TSE:2384) Still Below Fair Value On Raised Guidance And Dividend?
Why SBS Holdings Stock Is Back in Focus After Its Latest Earnings
SBS Holdings (TSE:2384) has come back into focus after a cluster of updates on 7 August 2026. The company reported higher than expected half year results, raised full year forecasts, and lifted its dividend guidance.
The revised outlook follows the H1 2026 earnings call. Management pointed to stronger net sales from both new and existing customers, and SBS Holdings also highlighted progress in pricing and efforts to improve the profitability of underperforming locations.
See our latest analysis for SBS Holdings.
The series of earnings, guidance and dividend announcements on 7 August has coincided with firm share price momentum for SBS Holdings, with a 30 day share price return of 9.32% and a year to date share price return of 27.17%. The 1 year total shareholder return of 47.96% and 3 year total shareholder return of 79.12% point to investors steadily reassessing the risk and reward profile over a longer horizon.
If these results have you rethinking logistics and infrastructure related themes, it can be useful to widen the lens and look at companies exposed to automation and warehouse technology through our 37 robotics and automation stocks
After a sharp move in SBS Holdings and upbeat guidance, the stock still trades below both analyst targets and one measure of estimated fair value. Is that discount caution you should share, or an opportunity the market is overpricing?
Price-To-Earnings Of 9.9x For SBS Holdings: Is It Justified?
On a simple P/E basis, SBS Holdings looks inexpensive. The stock closed at ¥4,985, and several checks point to it trading at what is described as good value compared to peers and the wider logistics industry.
The P/E ratio compares the share price to earnings per share. For a logistics group like SBS Holdings, it gives a quick read on how the market is valuing each unit of current earnings relative to similar companies.
According to the data, SBS Holdings is viewed as good value based on a P/E of 9.9x versus a peer average of 15.6x and a Japan logistics industry average of 15.4x. It is also described as good value when compared to an estimated fair P/E of 10.8x. This indicates that the market valuation could shift closer to that level if sentiment or expectations change.
Explore the SWS fair ratio for SBS Holdings
Alongside the P/E checks, the SWS DCF model estimates a future cash flow value of ¥8,349.93 per share for SBS Holdings compared with the last close at ¥4,985. This implies a substantial gap between the modelled value of future cash flows and the current market price. The DCF framework projects future cash flows and discounts them back to today using a required return, which can help investors frame how much they are paying for those projected cash flows.
For a logistics business with annual revenue of ¥556,063m and annual net income of ¥19,921m, that cash flow based view provides a different angle to the earnings multiple. It can be useful for investors who want to compare what they pay today against a long term stream of cash generation rather than a single year of profit.
Look into how the SWS DCF model arrives at its fair value.
Result: Price-to-Earnings of 9.9x (UNDERVALUED)
However, SBS Holdings still carries risks around slowing net income growth and its heavy reliance on Japan, both of which could challenge current cash flow expectations.
Find out about the key risks to this SBS Holdings narrative.
Another View On SBS Holdings Using The SWS DCF Model
The earnings based view suggests SBS Holdings looks inexpensive, yet the SWS DCF model goes even further. It estimates future cash flow value at ¥8,349.93 per share versus the recent ¥4,985 price, which points to a much deeper potential undervaluation if those cash flows materialize.
That is a wide gap for you to judge. It raises a simple question. Is the market correctly pricing the risks around SBS Holdings, or is it leaning too hard on shorter term concerns and underestimating the longer term cash generation story?
Look into how the SWS DCF model arrives at its fair value.
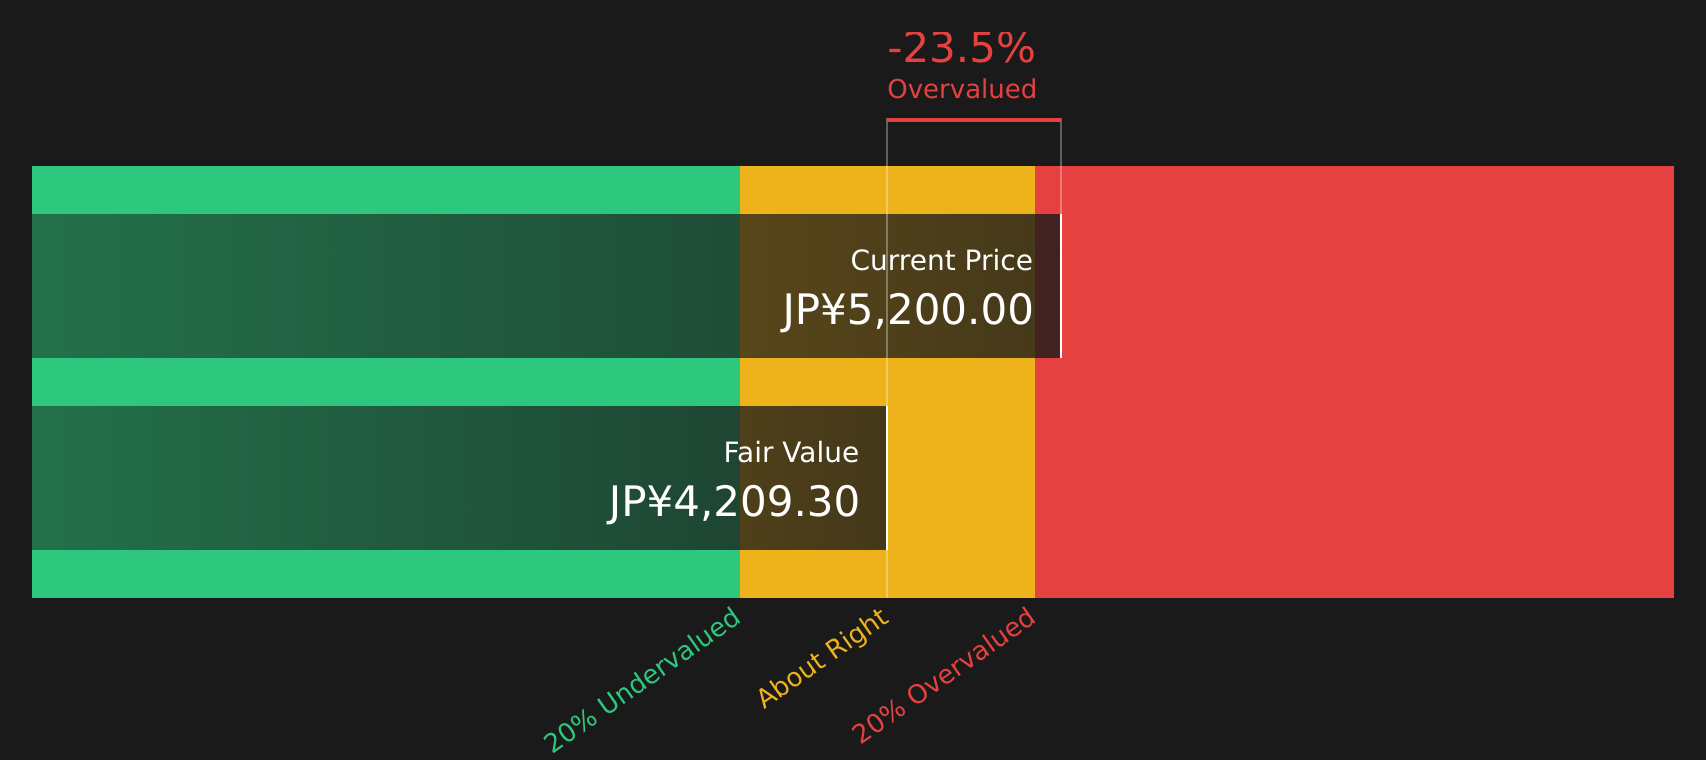
Simply Wall St performs a discounted cash flow (DCF) on every stock in the world every day (check out SBS Holdings for example). We show the entire calculation in full. You can track the result in your watchlist or portfolio and be alerted when this changes, or use our stock screener to discover 27 high quality undervalued stocks. If you save a screener we even alert you when new companies match - so you never miss a potential opportunity.
Next Steps
With SBS Holdings showing both appealing valuation signals and some clear question marks, it may be useful to review the data and assess the figures yourself. To see both sides of the story in one place, review the 3 key rewards and 3 important warning signs.
Looking For More Investment Ideas Beyond SBS Holdings?
If SBS Holdings has sharpened your focus on opportunities, do not stop here. Use the Simply Wall St screener to uncover other ideas before the crowd notices.
- Target dependable cash generators by reviewing companies with strong payouts and stability through the 34 dividend fortresses.
- Hunt for potential mispriced opportunities by scanning the 27 high quality undervalued stocks that match your preferred quality and valuation filters.
- Prioritise resilience by researching companies highlighted in the 60 resilient stocks with low risk scores and see which businesses score well on lower risk profiles.
This article by Simply Wall St is general in nature. We provide commentary based on historical data and analyst forecasts only using an unbiased methodology and our articles are not intended to be financial advice. It does not constitute a recommendation to buy or sell any stock, and does not take account of your objectives, or your financial situation. We aim to bring you long-term focused analysis driven by fundamental data. Note that our analysis may not factor in the latest price-sensitive company announcements or qualitative material. Simply Wall St has no position in any stocks mentioned.
Have feedback on this article? Concerned about the content? Get in touch with us directly. Alternatively, email editorial-team@simplywallst.com