


Sinfonia TechnologyLtd (TSE:6507) Could Be 32% Overvalued Following Guidance And Dividend Lift
Sinfonia Technology Ltd (TSE:6507) has drawn fresh attention after releasing first quarter results, issuing full year earnings guidance and outlining a higher dividend forecast for the year ending March 31, 2027.
See our latest analysis for Sinfonia TechnologyLtd.
Against this backdrop of guidance and dividend news, Sinfonia TechnologyLtd’s share price has pulled back over the past month, with a 30 day share price return of 10.06% and a 90 day share price return of 11.83%. At the same time, the year to date share price return of 36.56% and a 1 year total shareholder return of 55.18% point to strong longer term momentum.
If Sinfonia TechnologyLtd’s recent move has you thinking about other industrial and automation opportunities, it could be worth scanning 39 robotics and automation stocks for ideas beyond this stock.
Sinfonia Technology Ltd now combines upbeat guidance, a richer dividend outlook and a strong 1 year run, yet the share price has cooled in the short term. Does that set up a fair entry today or a case for patience as valuation comes into focus next?
Price-to-Earnings of 25.3x: Is it justified?
On the latest numbers, Sinfonia TechnologyLtd trades on a P/E of 25.3x, which sits above both its peers and the wider JP Electrical industry average.
The P/E ratio compares the current share price with the company’s earnings per share. For a business like Sinfonia TechnologyLtd that already reports profit and is growing both revenue and net income, this metric gives a quick sense of how much investors are paying for each unit of current earnings.
Analysts expect earnings to grow about 13.9% per year and revenue about 10.9% per year, which is faster than forecasts for the broader JP market. The market may be pricing in this stronger earnings and revenue profile, yet the current 25.3x still stands well ahead of the Electrical industry average of 14x. It is also above the estimated fair P/E of 23x, a level that the market could move toward if expectations and pricing become more closely aligned.
Explore the SWS fair ratio for Sinfonia TechnologyLtd
Result: Price-to-Earnings of 25.3x (OVERVALUED)
However, there are clear risks. A P/E well above the Electrical industry and reliance on cyclical capital spending could quickly challenge the bullish Sinfonia TechnologyLtd narrative.
Find out about the key risks to this Sinfonia TechnologyLtd narrative.
Another view on Sinfonia TechnologyLtd’s value
While the P/E of 25.3x already looks full, our DCF model paints an even tougher picture for Sinfonia TechnologyLtd. Using this method, the estimated value is ¥9,070.4 per share, which sits below the current price of ¥13,410. That indicates the stock may be overvalued based on these cash flow assumptions.
Look into how the SWS DCF model arrives at its fair value.
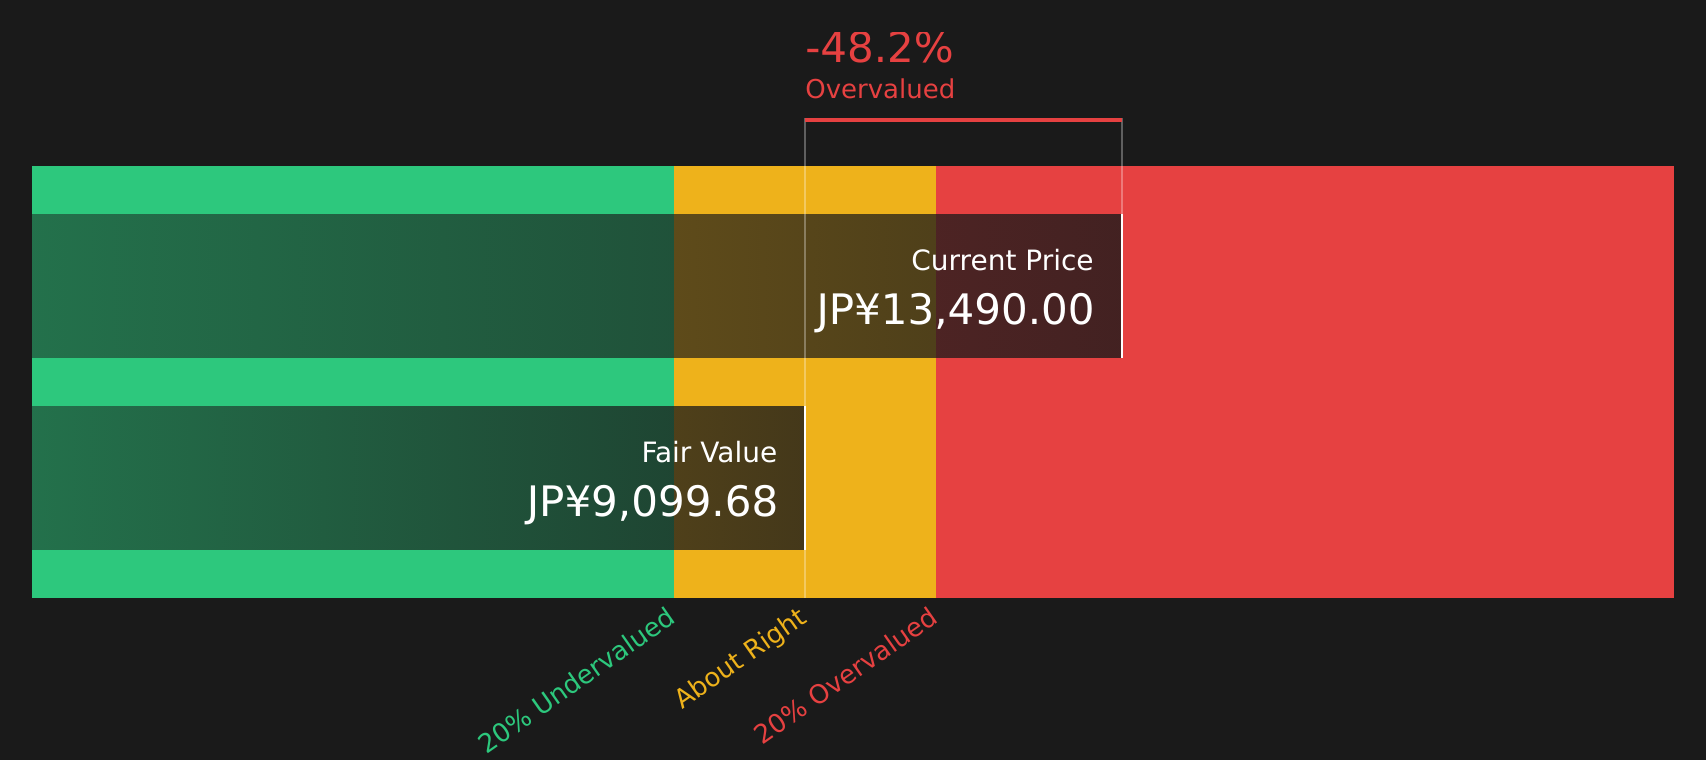
Simply Wall St performs a discounted cash flow (DCF) on every stock in the world every day (check out Sinfonia TechnologyLtd for example). We show the entire calculation in full. You can track the result in your watchlist or portfolio and be alerted when this changes, or use our stock screener to discover 25 high quality undervalued stocks. If you save a screener we even alert you when new companies match - so you never miss a potential opportunity.
Next Steps
If this mix of positives and risks around Sinfonia TechnologyLtd feels finely balanced, now is the time to review the numbers yourself and decide where you stand. To help you weigh both sides, take a close look at the 2 key rewards and 1 important warning sign.
Looking for more investment ideas beyond Sinfonia TechnologyLtd?
Do not stop with just one stock. Use the Simply Wall Street screener to quickly surface fresh opportunities that match your goals and risk comfort.
- Target dependable cash generation and balance sheet strength by scanning the solid balance sheet and fundamentals stocks screener (41 results) that could handle tougher conditions without breaking stride.
- Hunt for potential value opportunities by reviewing the 25 high quality undervalued stocks that currently trade below what their fundamentals might support.
- Spot lesser-known prospects by checking the screener containing 69 high quality undiscovered gems before other investors start paying closer attention.
This article by Simply Wall St is general in nature. We provide commentary based on historical data and analyst forecasts only using an unbiased methodology and our articles are not intended to be financial advice. It does not constitute a recommendation to buy or sell any stock, and does not take account of your objectives, or your financial situation. We aim to bring you long-term focused analysis driven by fundamental data. Note that our analysis may not factor in the latest price-sensitive company announcements or qualitative material. Simply Wall St has no position in any stocks mentioned.
Have feedback on this article? Concerned about the content? Get in touch with us directly. Alternatively, email editorial-team@simplywallst.com