


HORIBA (TSE:6856) Could Be 4% Below Fair Value On Raised Guidance And Dividends
HORIBA (TSE:6856) has drawn fresh attention after raising earnings guidance for 2026 and 2028, and outlining a special, commemorative, and higher ordinary dividend, following its market capitalization surpassing ¥1t.
See our latest analysis for HORIBA.
Despite the fresh guidance and dividend announcements on 7 August 2026, HORIBA's share price has eased recently, with a 30 day share price return of a 13.23% decline, even as the year to date share price return stands at 53.51% and the 1 year total shareholder return is 133.08%, suggesting strong longer term momentum behind the stock.
If this kind of move has you thinking about what else is on the move in related areas, it could be worth scanning other robotics and automation opportunities through the 39 robotics and automation stocks.
Bulls see HORIBA’s upgraded guidance and richer dividends as support for the recent rerating, while bears point to the sharp pullback and question how much is already priced in. What do the current valuation metrics actually suggest?
Price to earnings of 24.5x, is it justified for HORIBA?
On the latest figures, HORIBA trades on a P/E of 24.5x, which sits above both the Japanese Electronic industry average of 15.9x and the peer group average of 21.6x.
The P/E ratio compares the current share price to earnings per share. For a company like HORIBA, with forecast earnings growth of 12.97% per year and high quality earnings, a higher multiple often reflects the market's willingness to pay more for each unit of current earnings because of those expectations.
That premium is clear. The current 24.5x P/E is higher than the industry and peer averages, and also above the estimated fair P/E of 21.7x that the SWS model suggests the market could move towards over time if expectations cool. At the same time, the stock is described as trading at 3.8% below the SWS estimate of fair value based on future cash flows of ¥26,047.52 per share and is viewed as undervalued against that DCF based fair value, which shows how different approaches can point in different directions for HORIBA.
Explore the SWS fair ratio for HORIBA.
Result: Price-to-earnings of 24.5x (OVERVALUED)
However, HORIBA’s story could be tested if earnings growth slows from current forecasts, or if renewed share price volatility weakens confidence in that premium valuation.
Find out about the key risks to this HORIBA narrative.
Another view on HORIBA using the SWS DCF model
The picture changes when using the SWS DCF model. On this approach, HORIBA at ¥25,060 is described as trading around 3.8% below an estimated future cash flow value of ¥26,047.52 per share, which points to a modest undervaluation rather than an expensive stock. Which signal do you give more weight to?
For readers who want to see how that cash flow based estimate is built line by line, it can help to review the full model and its key assumptions before making any decisions. Look into how the SWS DCF model arrives at its fair value.
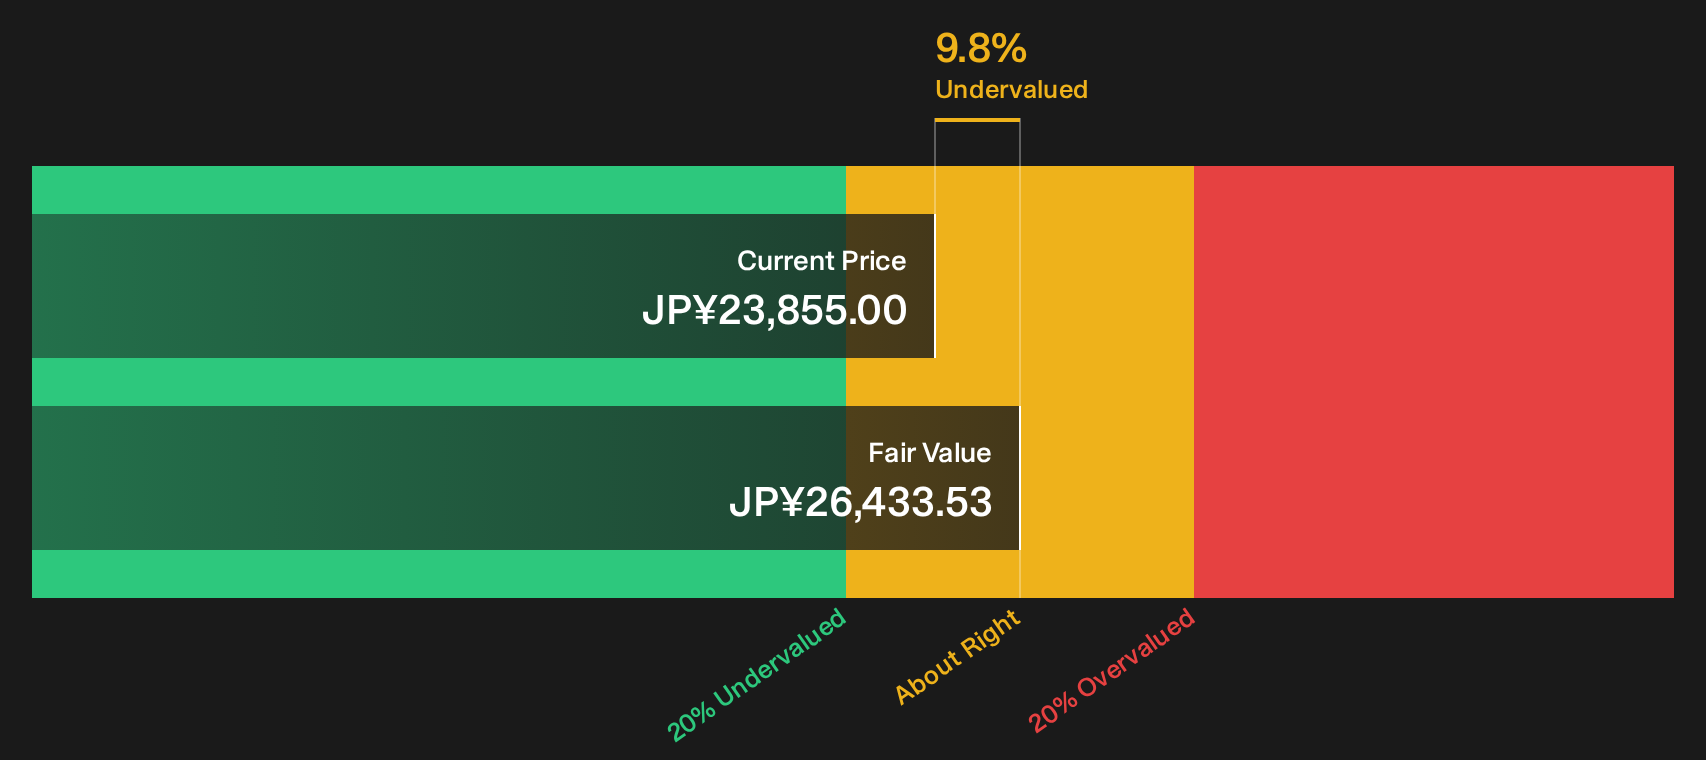
Simply Wall St performs a discounted cash flow (DCF) on every stock in the world every day (check out HORIBA for example). We show the entire calculation in full. You can track the result in your watchlist or portfolio and be alerted when this changes, or use our stock screener to discover 25 high quality undervalued stocks. If you save a screener we even alert you when new companies match - so you never miss a potential opportunity.
Next Steps
With HORIBA sending mixed signals on value and growth, it may be useful to act promptly and weigh the positives against the concerns yourself. To see the balance of potential upsides and the key issues flagged by other investors, check out the 3 key rewards and 2 important warning signs.
Looking for more investment ideas beyond HORIBA?
If HORIBA has you thinking more broadly about where to put your money to work next, it makes sense to scan a wider set of opportunities right now.
- Hunt for potential mispriced opportunities by reviewing the 25 high quality undervalued stocks that combine solid fundamentals with room for the market to reassess them.
- Strengthen the defensive side of your portfolio by checking the 57 resilient stocks with low risk scores that score well on resilience when conditions get choppy.
- Get ahead of the crowd by searching the screener containing 69 high quality undiscovered gems that have quality metrics but still sit off most investors' radar.
This article by Simply Wall St is general in nature. We provide commentary based on historical data and analyst forecasts only using an unbiased methodology and our articles are not intended to be financial advice. It does not constitute a recommendation to buy or sell any stock, and does not take account of your objectives, or your financial situation. We aim to bring you long-term focused analysis driven by fundamental data. Note that our analysis may not factor in the latest price-sensitive company announcements or qualitative material. Simply Wall St has no position in any stocks mentioned.
Have feedback on this article? Concerned about the content? Get in touch with us directly. Alternatively, email editorial-team@simplywallst.com