


Undiscovered Canadian Gems With Promising Potential In August 2026
As Canada's labour market shows signs of strength with a notable increase in employment and declining unemployment rates, the country's economic recovery appears to be gaining momentum without triggering inflation concerns. In this environment, identifying promising small-cap stocks can be particularly rewarding, as these companies often benefit from broader economic growth and have the potential for significant upside when fundamentals align with market conditions.
Top 5 Undiscovered Gems With Strong Fundamentals In Canada
| Name | Debt To Equity | Revenue Growth | Earnings Growth | Health Rating |
|---|---|---|---|---|
| Fortuna Mining | 7.64% | 12.54% | 45.56% | ★★★★★★ |
| Calfrac Well Services | 18.28% | 8.25% | 17.87% | ★★★★★★ |
| Thor Explorations | NA | 38.45% | 61.95% | ★★★★★★ |
| Alvopetro Energy | 18.59% | 7.72% | 6.43% | ★★★★★☆ |
| Artemis Gold | 33.63% | 94.01% | 83.79% | ★★★★☆☆ |
| Richards Group | 44.27% | -2.06% | -0.80% | ★★★★☆☆ |
| Logan Energy | 29.57% | 37.26% | 63.28% | ★★★☆☆☆ |
Let's explore several standout options from the results in the screener.
Fortuna Mining (TSX:FVI)
Simply Wall St Value Rating: ★★★★★★
Overview: Fortuna Mining Corp. is involved in precious and base metal mining operations across Argentina, Côte d’Ivoire, Mexico, Peru, and Senegal with a market capitalization of CA$4.47 billion.
Operations: Fortuna Mining generates revenue primarily from its Sango, Bateas, and Mansfield segments, with Sango contributing $680.37 million and Mansfield $357.12 million. The company has a market capitalization of CA$4.47 billion.
Fortuna Mining, a small Canadian company, is making strategic moves to bolster its growth through acquisitions and project expansions. Recently, it acquired the Bambadji gold exploration project in Senegal for US$200 million, enhancing its footprint in a key gold-producing region. The company's earnings grew 216% over the past year, significantly outpacing industry averages. Fortuna's debt-to-equity ratio has improved from 20.8% to 7.6% over five years, indicating stronger financial health. However, challenges remain with high operational costs and geopolitical risks potentially impacting cash flows despite robust revenue projections of 22.8% annual growth over three years.

Artemis Gold (TSXV:ARTG)
Simply Wall St Value Rating: ★★★★☆☆
Overview: Artemis Gold Inc. focuses on identifying, acquiring, and developing gold properties in Canada with a market cap of CA$9.31 billion.
Operations: Artemis Gold generates revenue primarily from the exploration and development of mineral properties, amounting to CA$1.39 billion.
Artemis Gold, a Canadian mining company, showcases remarkable growth potential with its recent financial performance and strategic expansions. The firm's earnings skyrocketed by 550% over the past year, far outpacing the industry average of 137.7%. With net income reaching C$199 million in Q2 2026 from C$100 million a year prior, Artemis is on solid footing. Its debt to equity ratio stands at a satisfactory 20.2%, ensuring financial stability while EBIT covers interest payments by an impressive 20.6 times. The ongoing expansion projects promise to boost gold production significantly and reduce operating costs further cementing its position as a high-margin operation globally.
- Get an in-depth perspective on Artemis Gold's performance by reading our health report here.
Explore historical data to track Artemis Gold's performance over time in our Past section.
Logan Energy (TSXV:LGN)
Simply Wall St Value Rating: ★★★☆☆☆
Overview: Logan Energy Corp. is involved in the exploration, development, and production of crude oil and natural gas properties with a market cap of CA$774.57 million.
Operations: Logan Energy generates revenue from the exploration, development, and production of crude oil and natural gas. The company's market capitalization stands at CA$774.57 million.
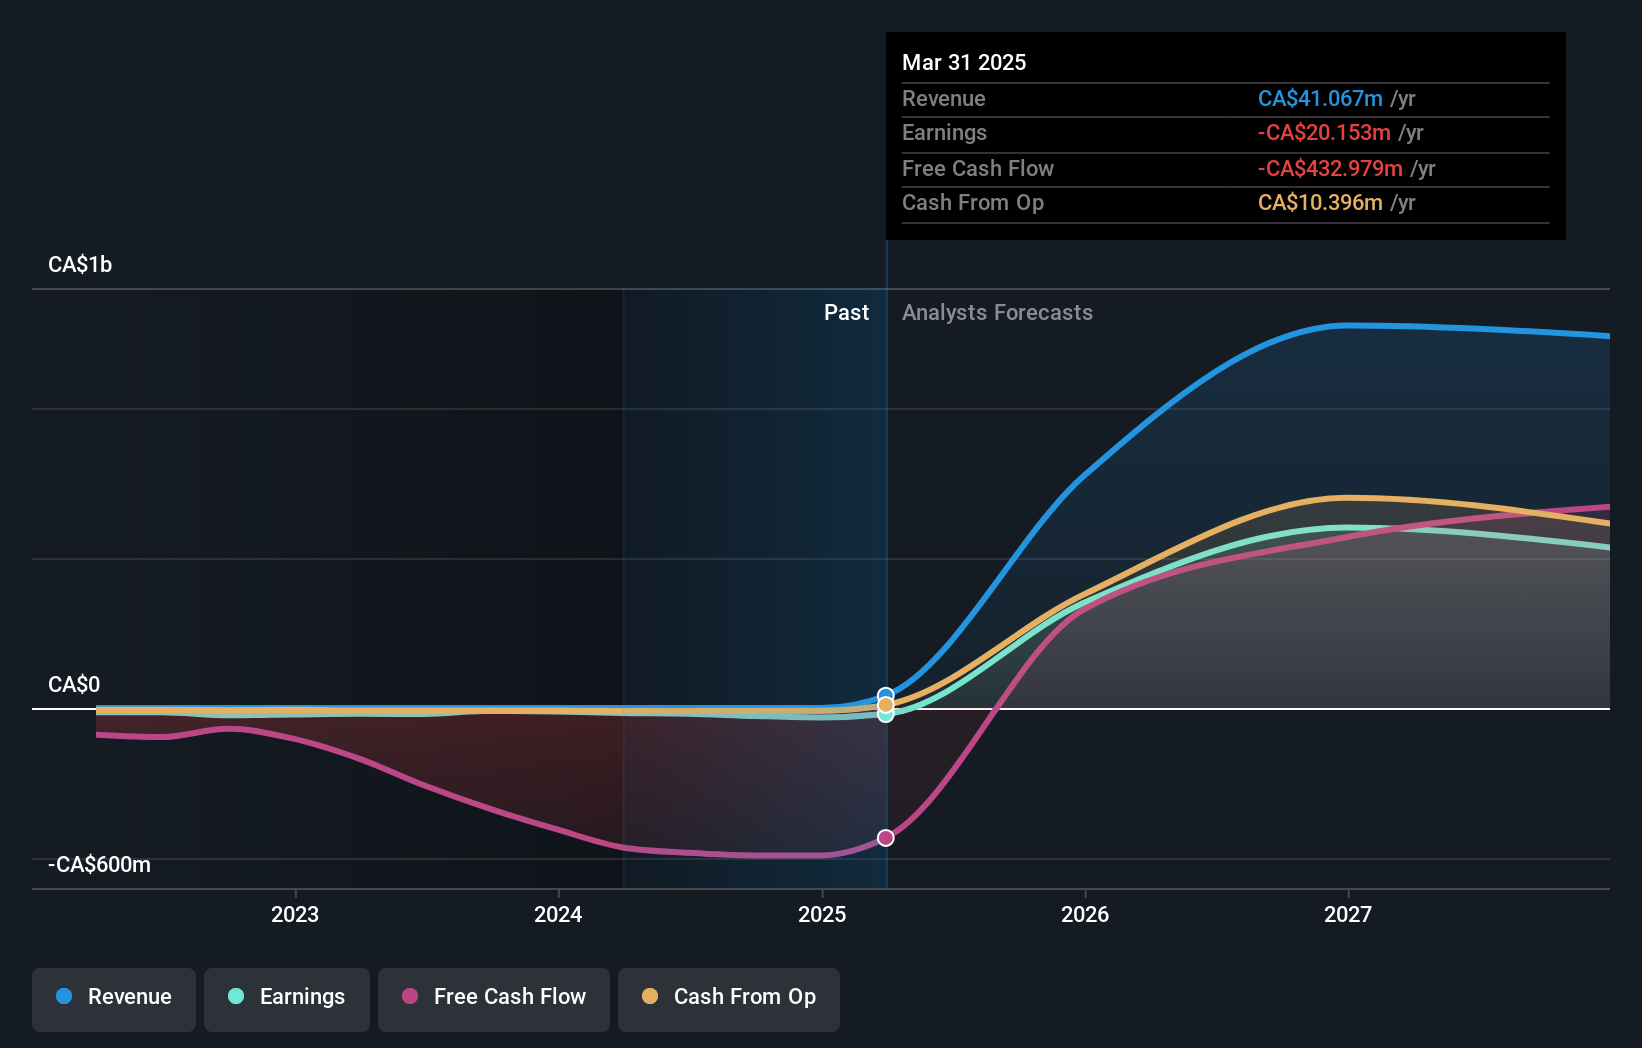
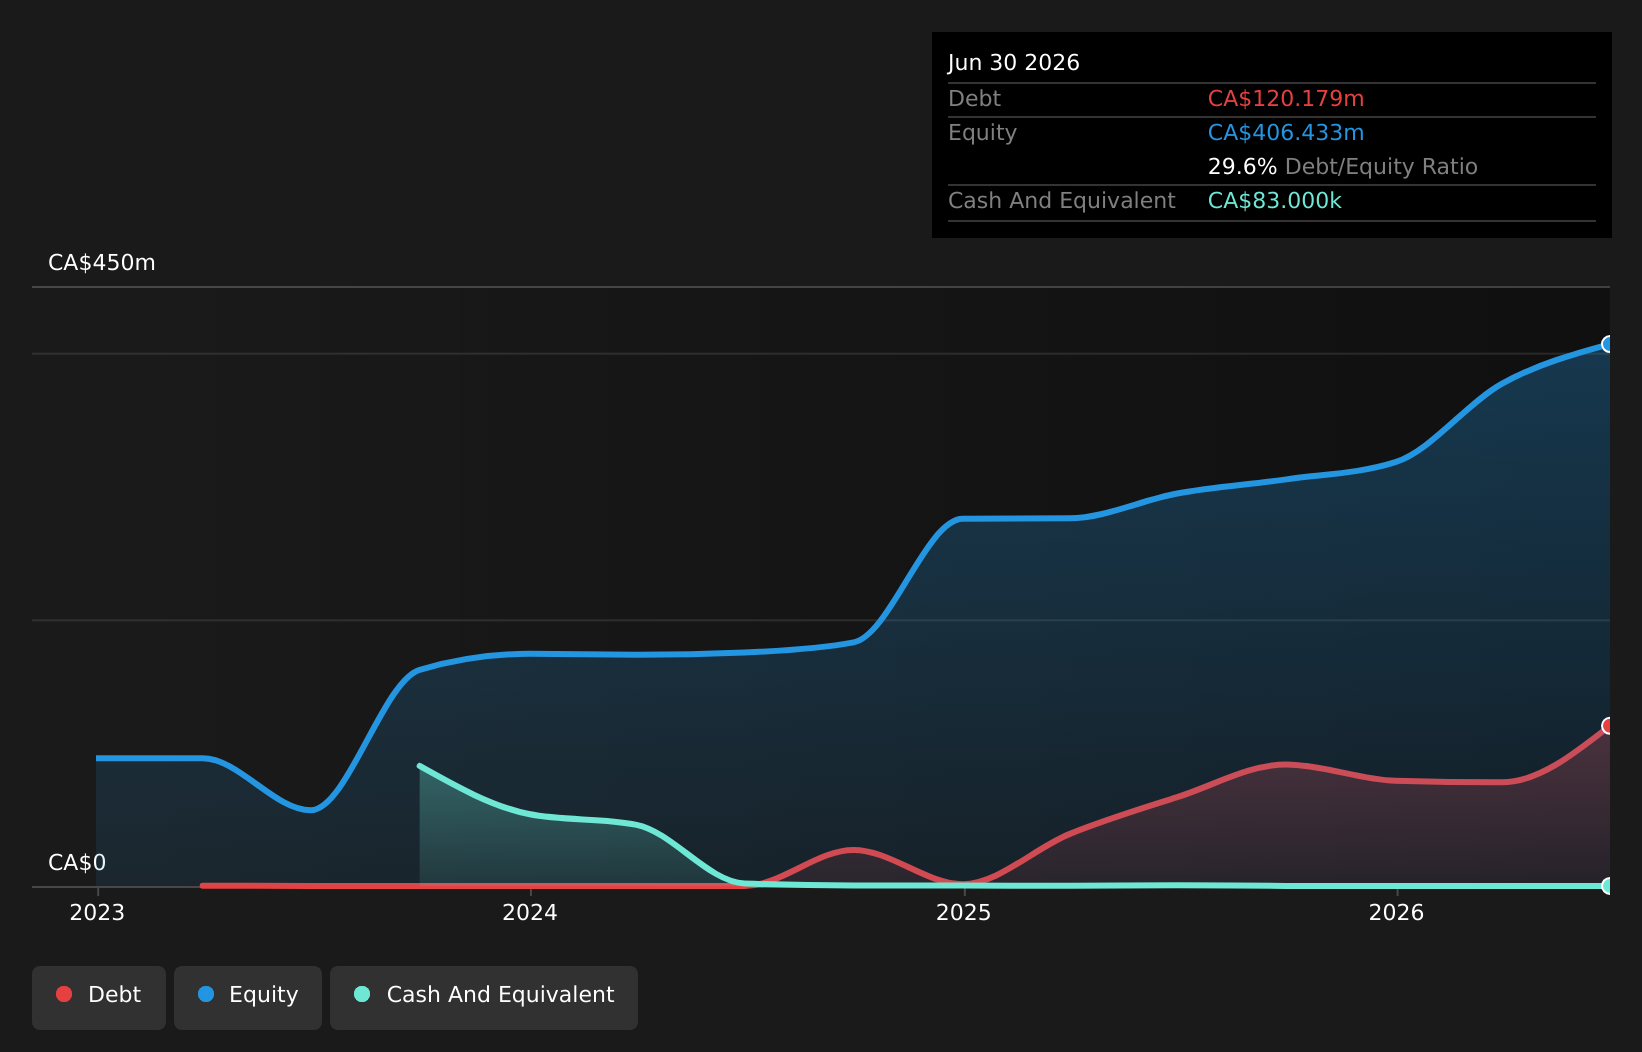
Logan Energy, a promising player in Canada’s energy sector, has seen its earnings soar by 72.1% over the past year, significantly outpacing the industry average of -8.9%. With revenue for Q2 2026 hitting CAD 76.65 million, up from CAD 40.51 million the previous year, and net income rising to CAD 28.36 million from CAD 17.31 million, Logan is on a growth trajectory that appears robust. The company trades at a substantial discount of nearly 86% below estimated fair value and maintains an EBIT coverage ratio of debt interest payments at an impressive 8.8x, underscoring financial health despite recent shareholder dilution concerns.
- Click here and access our complete health analysis report to understand the dynamics of Logan Energy.
Understand Logan Energy's track record by examining our Past report.
Key Takeaways
- Embark on your investment journey to our 7 TSX Undiscovered Gems With Strong Fundamentals selection here.
- Already own these companies? Link your portfolio to Simply Wall St and get alerts on any new warning signs to your stocks.
- Streamline your investment strategy with Simply Wall St's app for free and benefit from extensive research on stocks across all corners of the world.
Seeking Other Investments?
- Explore high-performing small cap companies that haven't yet garnered significant analyst attention.
- Fuel your portfolio with companies showing strong growth potential, backed by optimistic outlooks both from analysts and management.
- Find companies with promising cash flow potential yet trading below their fair value.
This article by Simply Wall St is general in nature. We provide commentary based on historical data and analyst forecasts only using an unbiased methodology and our articles are not intended to be financial advice. It does not constitute a recommendation to buy or sell any stock, and does not take account of your objectives, or your financial situation. We aim to bring you long-term focused analysis driven by fundamental data. Note that our analysis may not factor in the latest price-sensitive company announcements or qualitative material. Simply Wall St has no position in any stocks mentioned.
Have feedback on this article? Concerned about the content? Get in touch with us directly. Alternatively, email editorial-team@simplywallst.com