


San Miguel Food and Beverage And 2 Other Undiscovered Gems in Asia
In recent months, Asian markets have experienced varied performance, with the Shanghai Composite Index showing resilience while Hong Kong's Hang Seng Index faced challenges. Amid this backdrop of mixed market sentiment and economic indicators, investors are increasingly on the lookout for stocks that offer solid fundamentals and growth potential. Identifying such opportunities requires a keen understanding of market dynamics and the ability to spot companies like San Miguel Food and Beverage that may not yet be widely recognized but hold promise in their respective sectors.
Top 10 Undiscovered Gems With Strong Fundamentals In Asia
| Name | Debt To Equity | Revenue Growth | Earnings Growth | Health Rating |
|---|---|---|---|---|
| CNMC Goldmine Holdings | 0.84% | 32.52% | 78.36% | ★★★★★★ |
| Vector | 29.84% | 7.98% | 22.15% | ★★★★★★ |
| DeHua TB New Decoration MaterialLtd | 0.63% | 1.50% | 2.14% | ★★★★★★ |
| Nippon Carbide Industries | 14.39% | 2.05% | -0.55% | ★★★★★★ |
| Ad-Sol Nissin | NA | 7.22% | 15.60% | ★★★★★★ |
| Base | NA | 11.66% | 17.63% | ★★★★★★ |
| Zhejiang Jolly PharmaceuticalLTD | 21.31% | 17.83% | 29.70% | ★★★★★☆ |
| uSonar | 5.92% | 15.94% | 37.41% | ★★★★★☆ |
| Sing Investments & Finance | 0.10% | 5.85% | 7.00% | ★★★★☆☆ |
| Shengda ResourcesLtd | 57.58% | 8.61% | 9.90% | ★★★☆☆☆ |
We're going to check out a few of the best picks from our screener tool.
San Miguel Food and Beverage (PSE:FB)
Simply Wall St Value Rating: ★★★★★★
Overview: San Miguel Food and Beverage, Inc. is a company that focuses on the manufacturing and marketing of processed meat products in the Philippines, with a market capitalization of approximately ₱287.48 billion.
Operations: San Miguel Food and Beverage generates revenue primarily from three segments: Food (₱199.59 billion), Spirits (₱67.43 billion), and Beer and Non-Alcoholic Beverage (₱155.18 billion). The company focuses on these core areas to drive its financial performance in the Philippines.
San Miguel Food and Beverage showcases a compelling profile with earnings growth of 11.8% over the past year, outpacing the industry average of 1.6%. Trading at nearly 45% below its estimated fair value, it presents an attractive entry point for investors. The company has demonstrated prudent financial management with a net debt to equity ratio of 13.5%, deemed satisfactory, and interest payments well covered by EBIT at a ratio of 99x. Recent board meetings highlighted robust financials, including a consolidated net income of PHP22.1 billion for H1 2026 and declared dividends totaling PHP1.27 per share payable in September.

P.S.P. Specialties (SET:PSP)
Simply Wall St Value Rating: ★★★★★☆
Overview: P.S.P. Specialties Public Company Limited, along with its subsidiaries, focuses on the manufacturing and sale of lubricant and grease oils in Thailand, with a market capitalization of THB11.34 billion.
Operations: P.S.P. Specialties generates revenue primarily from the sale of lubricant and grease oils in Thailand. The company's cost structure includes expenses associated with manufacturing these products. Its market capitalization stands at THB11.34 billion, reflecting its financial position within the industry.
P.S.P. Specialties, a small cap player in the chemicals sector, has demonstrated impressive growth with earnings increasing by 38.4% over the past year, outpacing the industry average of 15.5%. The latest quarterly results show a significant rise in net income to THB 535.78 million from THB 260.78 million last year, reflecting strong operational performance and high-quality earnings. Despite an increase in its debt to equity ratio from 10.6% to 53.7% over five years, the company's net debt to equity remains satisfactory at 33.5%, with interest payments well covered by EBIT at a multiple of 19.6 times, indicating robust financial health and potential for continued growth given its valuation below estimated fair value by approximately 45%.

GA technologies (TSE:3491)
Simply Wall St Value Rating: ★★★★☆☆
Overview: GA technologies Co., Ltd. operates a real estate brokerage platform and has a market capitalization of approximately ¥60.72 billion.
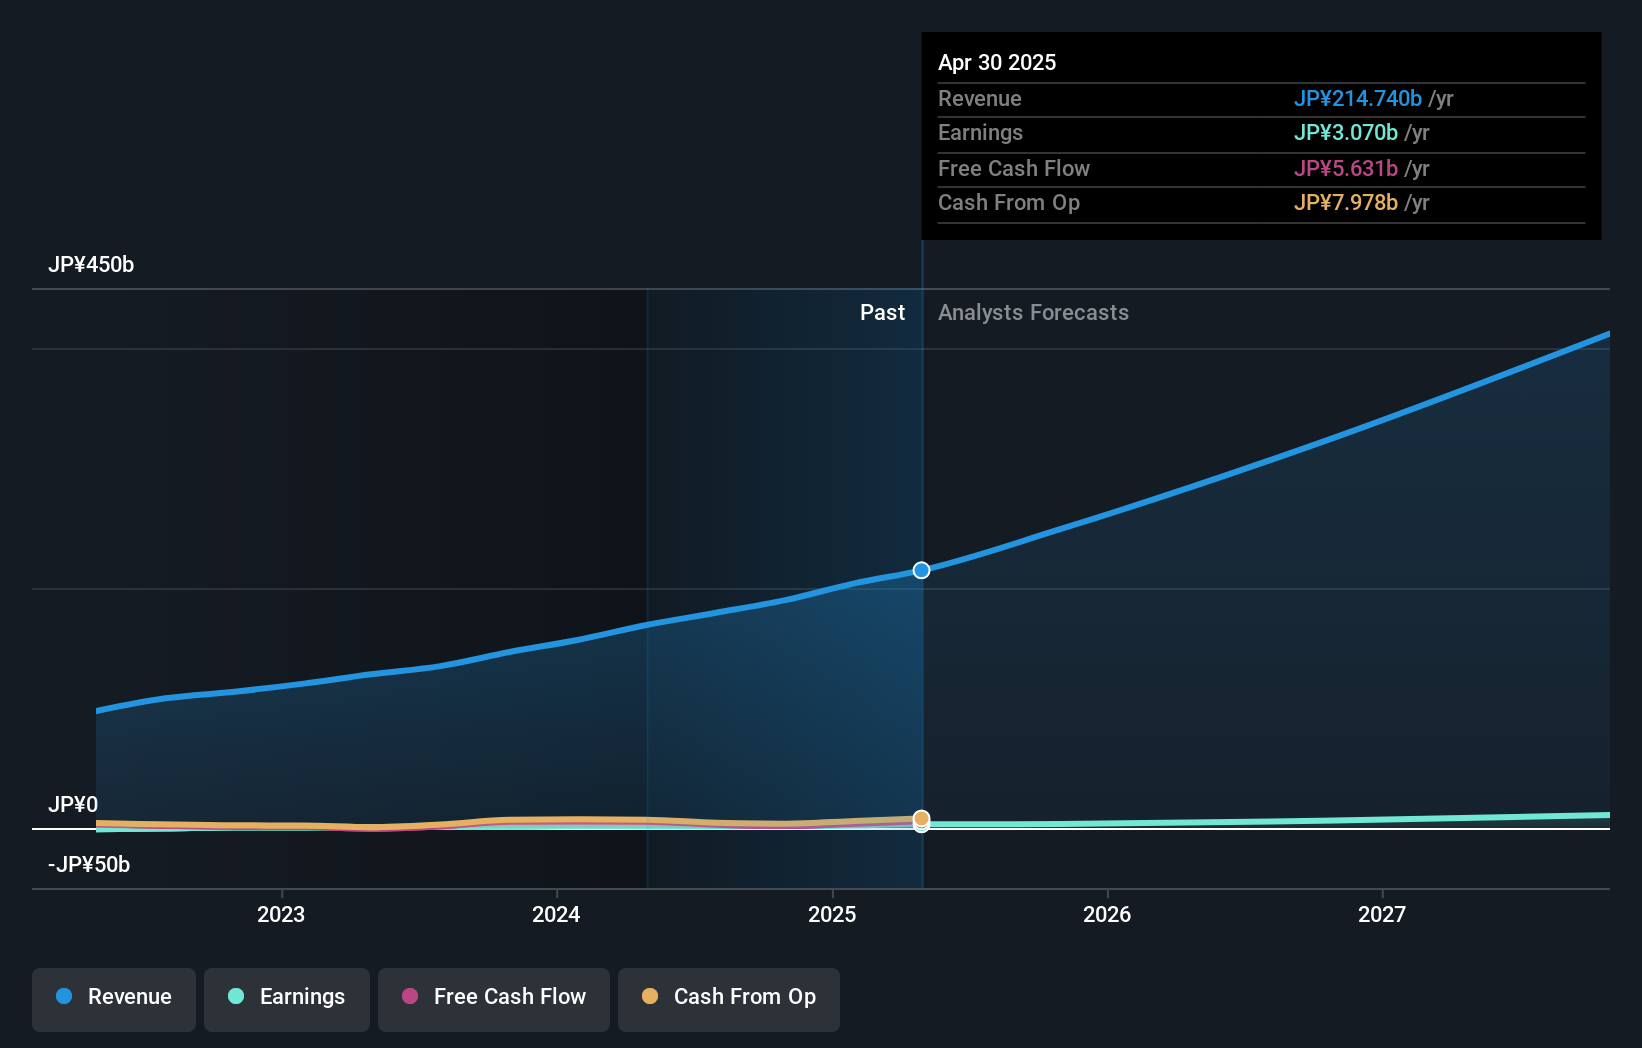
Operations: The primary revenue stream for GA technologies comes from the RENOSY Marketplace, generating ¥272.94 billion, while ITANDI contributes ¥6.89 billion. The company's net profit margin is a key financial metric to consider when evaluating its overall profitability and efficiency in managing costs relative to its revenue streams.
GA technologies, a small player in the Interactive Media and Services industry, has been making waves with its robust financial performance. Despite a volatile share price recently, it trades at 70% below estimated fair value, presenting an attractive buying opportunity. The company's earnings surged by 21.5% last year, outpacing the industry's 18.2% growth rate and showcasing high-quality past earnings. With interest payments well-covered by EBIT at 8.8 times and a satisfactory net debt to equity ratio of 1.9%, GA technologies seems financially sound despite its debt to equity ratio climbing from 32.7% to 93.1% over five years.
- Click here to discover the nuances of GA technologies with our detailed analytical health report.
Evaluate GA technologies' historical performance by accessing our past performance report.
Next Steps
- Reveal the 119 hidden gems among our Asian Undiscovered Gems With Strong Fundamentals screener with a single click here.
- Hold shares in these firms? Setup your portfolio in Simply Wall St to seamlessly track your investments and receive personalized updates on your portfolio's performance.
- Invest smarter with the free Simply Wall St app providing detailed insights into every stock market around the globe.
Looking For Alternative Opportunities?
- Explore high-performing small cap companies that haven't yet garnered significant analyst attention.
- Fuel your portfolio with companies showing strong growth potential, backed by optimistic outlooks both from analysts and management.
- Find companies with promising cash flow potential yet trading below their fair value.
This article by Simply Wall St is general in nature. We provide commentary based on historical data and analyst forecasts only using an unbiased methodology and our articles are not intended to be financial advice. It does not constitute a recommendation to buy or sell any stock, and does not take account of your objectives, or your financial situation. We aim to bring you long-term focused analysis driven by fundamental data. Note that our analysis may not factor in the latest price-sensitive company announcements or qualitative material. Simply Wall St has no position in any stocks mentioned.
Have feedback on this article? Concerned about the content? Get in touch with us directly. Alternatively, email editorial-team@simplywallst.com