


Meidensha (TSE:6508) Lifted Its Guidance, Is The Upside Already Priced In?
Meidensha (TSE:6508) has raised its earnings guidance for the half year to September 2026 and the full year to March 2027, after reporting stronger project progress and profitability than previously expected.
See our latest analysis for Meidensha.
The raised guidance follows a period of strong share price momentum for Meidensha, with a 30 day share price return of 35.46% and a year to date share price return of 102.04%, supported by a 1 year total shareholder return of 101.63% that includes dividends.
If this earnings upgrade has you looking beyond Meidensha, it may be a time to scan other power and grid related opportunities through our 35 power grid technology and infrastructure stocks
After such a sharp re rating on Meidensha’s upgraded forecasts, the key tension is clear: Is the recent surge already pricing in most of the good news, or does the current valuation still leave meaningful upside on the table?
Price to Earnings of 19.1x: Is Meidensha’s premium justified?
On the latest numbers, Meidensha trades on a P/E of 19.1x, which sits above the JP Machinery industry average of 13.4x but is close to its estimated fair P/E of 19.5x and below the peer average of 34.3x.
The P/E ratio tells you how much investors are currently paying for each unit of Meidensha’s earnings. For a company with established operations across power infrastructure, mobility systems, water treatment and industrial equipment, this is a common way for the market to frame expectations for future profitability.
Recent data shows a few things at once. Earnings growth has been strong in the recent period and has outpaced the broader Machinery industry, yet forecasts point to more moderate profit growth ahead and a Return on Equity that sits below the 20% threshold often seen in higher quality compounders. Against that backdrop, the market is assigning Meidensha a P/E that is richer than the sector average but very close to the SWS fair ratio estimate. This suggests expectations are neither overly conservative nor excessively stretched.
Compared to the Machinery industry’s 13.4x, Meidensha’s 19.1x P/E is materially higher, which indicates investors are willing to pay a premium relative to the sector. However, when set against the peer average of 34.3x and the estimated fair P/E of 19.5x, the current multiple looks more restrained. The fair ratio gives a guide to where the valuation could gravitate if the market continues to align price more closely with earnings quality and growth characteristics.
Explore the SWS fair ratio for Meidensha.
Result: Price-to-Earnings of 19.1x (ABOUT RIGHT)
However, Meidensha still faces possible pressure if the timing of infrastructure projects shifts or if recent share price gains cool investor enthusiasm for its current valuation.
Find out about the key risks to this Meidensha narrative.
Another view on Meidensha’s value
While the P/E of 19.1x suggests Meidensha is roughly in line with its fair ratio of 19.5x, the SWS DCF model points to a slightly different angle. At a share price of ¥11,880 versus an estimated future cash flow value of ¥12,032.93, the stock screens as around 1.3% below that fair value. With both methods pointing in a similar direction, the question is which one you treat as your anchor when expectations shift.
Look into how the SWS DCF model arrives at its fair value..
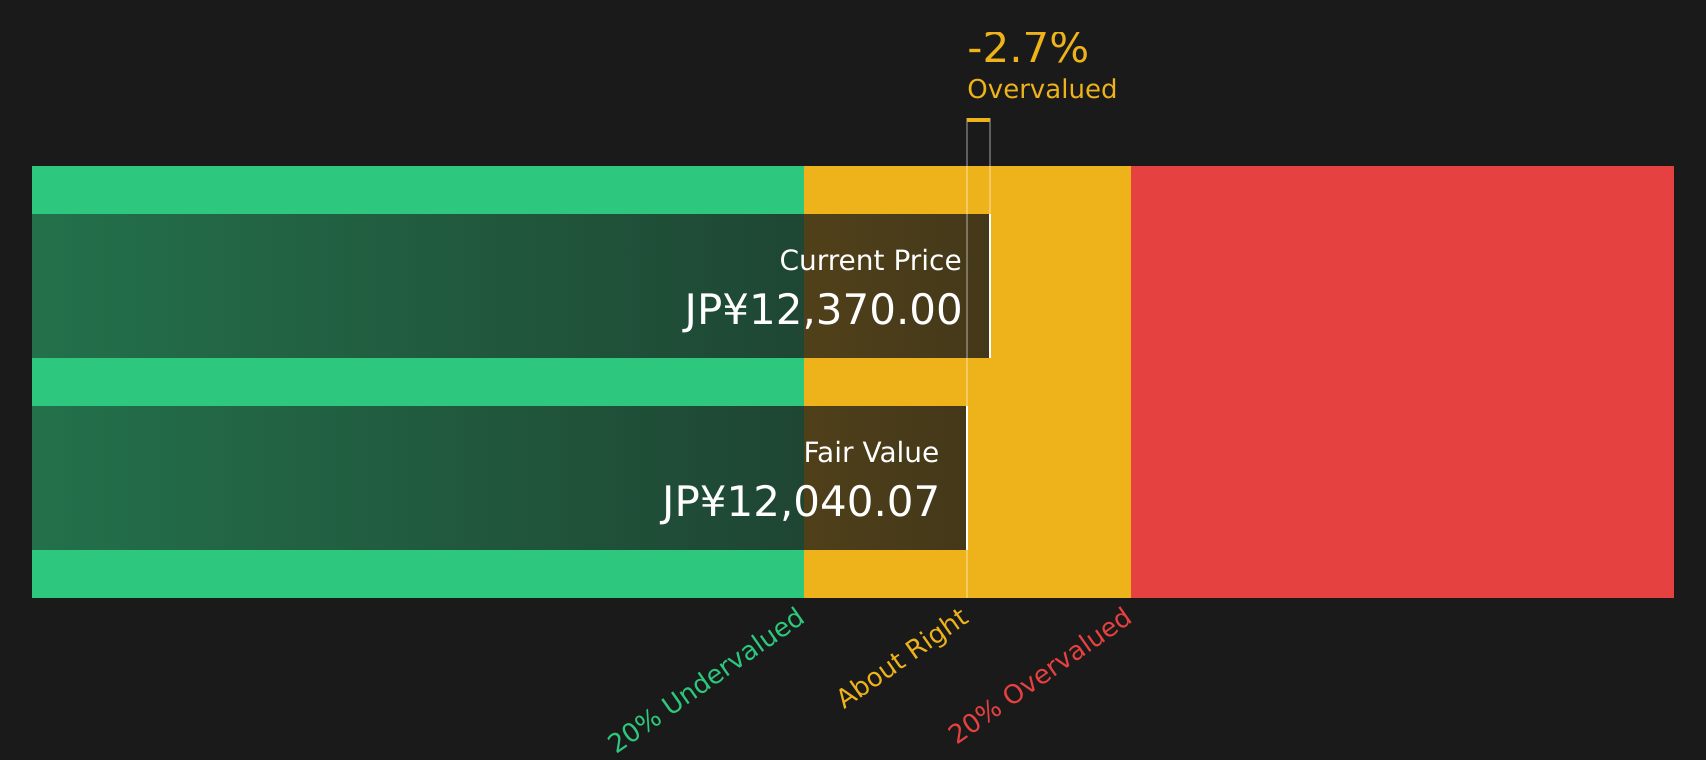
Simply Wall St performs a discounted cash flow (DCF) on every stock in the world every day (check out Meidensha for example). We show the entire calculation in full. You can track the result in your watchlist or portfolio and be alerted when this changes, or use our stock screener to discover 23 high quality undervalued stocks. If you save a screener we even alert you when new companies match - so you never miss a potential opportunity.
Next Steps
The mixed signals on Meidensha’s valuation and outlook make this a stock that deserves closer attention from your own research, not just headline numbers. If you want a balanced snapshot of what the market currently sees as the main concerns and bright spots, take a look at the 3 key rewards and 1 important warning sign.
Looking for more investment ideas beyond Meidensha?
If Meidensha has sharpened your focus, do not stop your research here. Use the Simply Wall St screener to find other opportunities that match your investing style.
- Supercharge your watchlist by scanning for quality companies trading below their estimated worth through the 23 high quality undervalued stocks.
- Strengthen your income focus by checking out stocks that offer resilient payouts via the 37 dividend fortresses.
- Prioritise resilience by reviewing companies with sturdy finances using the solid balance sheet and fundamentals stocks screener (41 results).
This article by Simply Wall St is general in nature. We provide commentary based on historical data and analyst forecasts only using an unbiased methodology and our articles are not intended to be financial advice. It does not constitute a recommendation to buy or sell any stock, and does not take account of your objectives, or your financial situation. We aim to bring you long-term focused analysis driven by fundamental data. Note that our analysis may not factor in the latest price-sensitive company announcements or qualitative material. Simply Wall St has no position in any stocks mentioned.
Have feedback on this article? Concerned about the content? Get in touch with us directly. Alternatively, email editorial-team@simplywallst.com