


Undiscovered Gems In Asia To Watch This August 2026
As global markets navigate a landscape marked by strong U.S. stock index performances and resilient business activity, Asia's small-cap sector presents intriguing opportunities amidst broader economic shifts. In such a dynamic environment, identifying stocks with robust fundamentals and growth potential can offer investors unique insights into emerging market trends.
Top 10 Undiscovered Gems With Strong Fundamentals In Asia
| Name | Debt To Equity | Revenue Growth | Earnings Growth | Health Rating |
|---|---|---|---|---|
| CNMC Goldmine Holdings | 0.84% | 32.52% | 78.36% | ★★★★★★ |
| DeHua TB New Decoration MaterialLtd | 0.63% | 1.50% | 2.14% | ★★★★★★ |
| Nippon Carbide Industries | 14.39% | 2.05% | -0.55% | ★★★★★★ |
| Ad-Sol Nissin | NA | 7.22% | 15.60% | ★★★★★★ |
| Base | NA | 11.66% | 17.63% | ★★★★★★ |
| BBGI | 18.41% | 10.19% | -20.25% | ★★★★★★ |
| Zhejiang Jolly PharmaceuticalLTD | 21.31% | 17.83% | 29.70% | ★★★★★☆ |
| uSonar | 5.92% | 15.93% | 37.38% | ★★★★★☆ |
| Sing Investments & Finance | 0.10% | 5.85% | 7.00% | ★★★★☆☆ |
| Shengda ResourcesLtd | 57.58% | 8.61% | 9.90% | ★★★☆☆☆ |
Underneath we present a selection of stocks filtered out by our screen.
Shanghai Allist Pharmaceuticals (SHSE:688578)
Simply Wall St Value Rating: ★★★★★★
Overview: Shanghai Allist Pharmaceuticals Co., Ltd. is a pharmaceutical company focused on the research and development of tumor-targeted drugs in China and internationally, with a market cap of CN¥52.79 billion.
Operations: Allist Pharmaceuticals generates revenue primarily from its research and development of drugs, amounting to CN¥5.67 billion.
Shanghai Allist Pharmaceuticals, a nimble player in the pharma scene, is debt-free and trading at 55.7% below its estimated fair value. Over the past year, earnings surged by 57.4%, outpacing the broader pharmaceuticals industry which saw a -1.6% dip. The company's strategic collaboration with TransThera Sciences aims to advance cancer treatment through an ongoing Phase II clinical trial for non-small cell lung cancer therapies. With high-quality past earnings and positive free cash flow, Allist seems poised for growth as it explores further clinical advancements in oncology treatments with promising early results from their trials.
- Take a closer look at Shanghai Allist Pharmaceuticals' potential here in our health report.
Understand Shanghai Allist Pharmaceuticals' track record by examining our Past report.

Shengda ResourcesLtd (SZSE:000603)
Simply Wall St Value Rating: ★★★☆☆☆
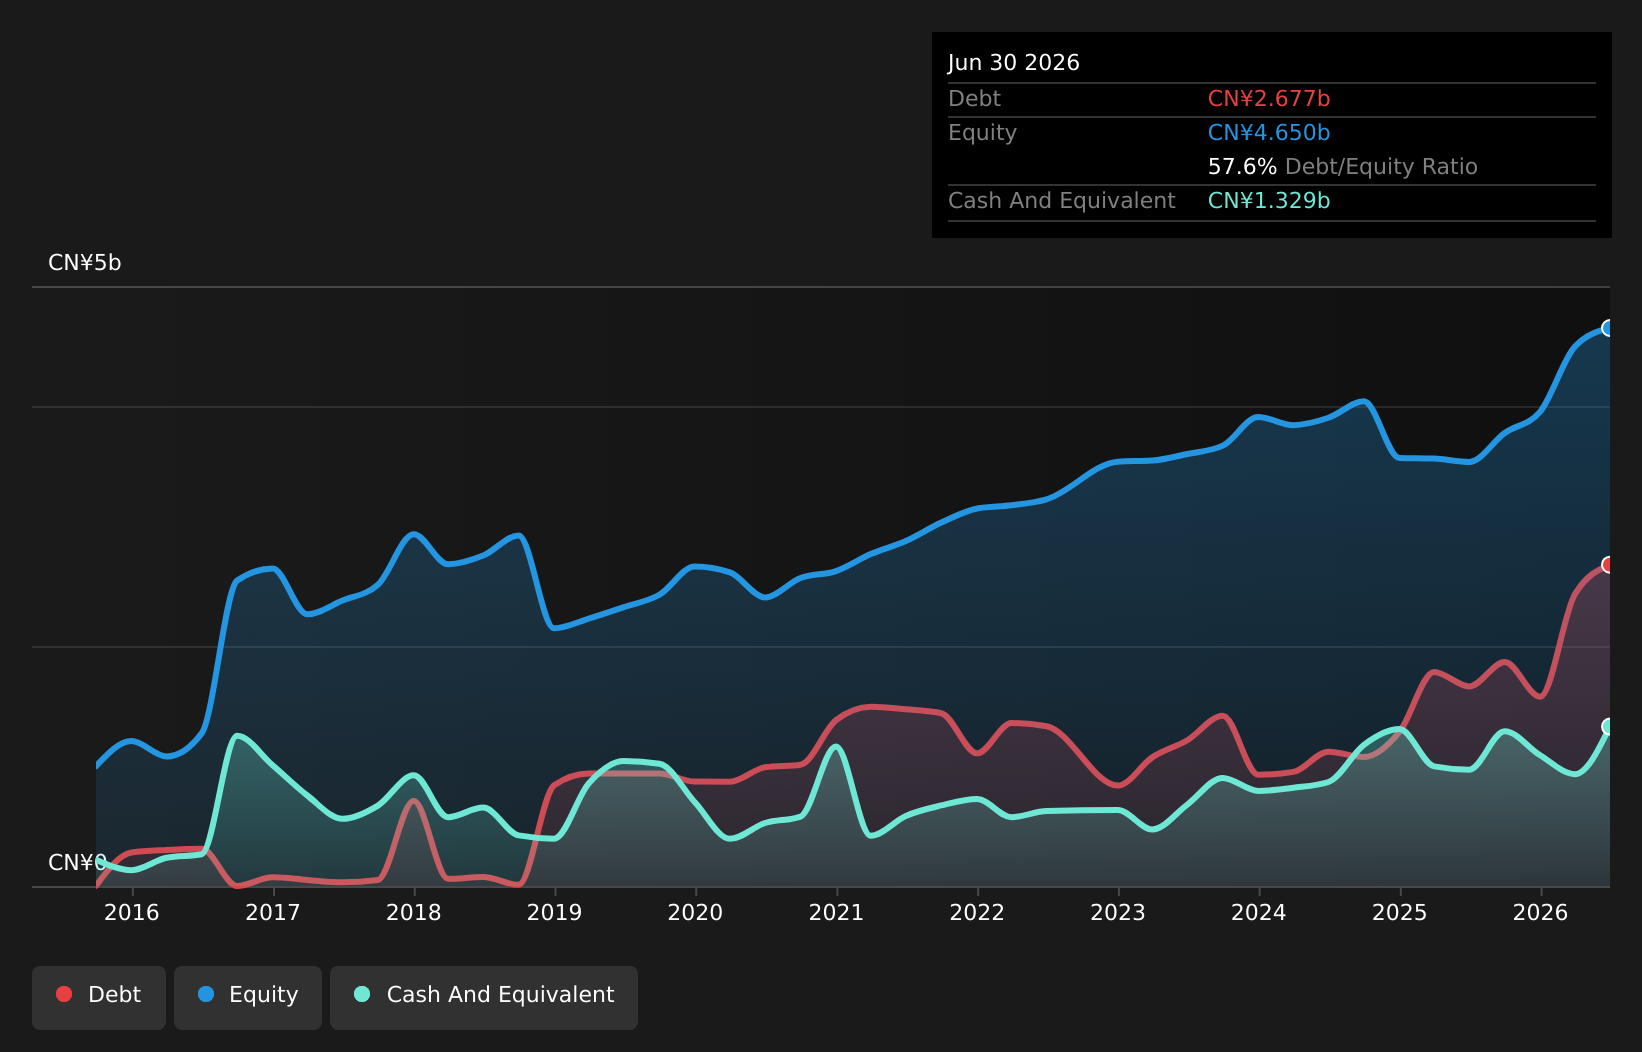
Overview: Shengda Resources Co., Ltd. operates through its subsidiaries in the mining, beneficiation, and sale of precious and non-ferrous metal ores in China, with a market capitalization of CN¥23.56 billion.
Operations: Shengda Resources generates revenue primarily from the mining, beneficiation, and sale of precious and non-ferrous metal ores. The company focuses on optimizing its cost structure to enhance profitability. Its financial performance is influenced by fluctuations in commodity prices and operational efficiencies.
Shengda Resources, a promising player in the metals and mining sector, has shown impressive growth with earnings surging 125.7% over the past year, outpacing industry averages. The company reported a net income of CNY 390 million for the first half of 2026, up from CNY 70 million last year. Trading at about 52% below its estimated fair value suggests potential upside for investors. Shengda's net debt to equity ratio stands at a satisfactory 29%, while interest payments are well covered by EBIT at nearly 30 times coverage, indicating strong financial health despite recent share price volatility.
NSD (TSE:9759)
Simply Wall St Value Rating: ★★★★★★
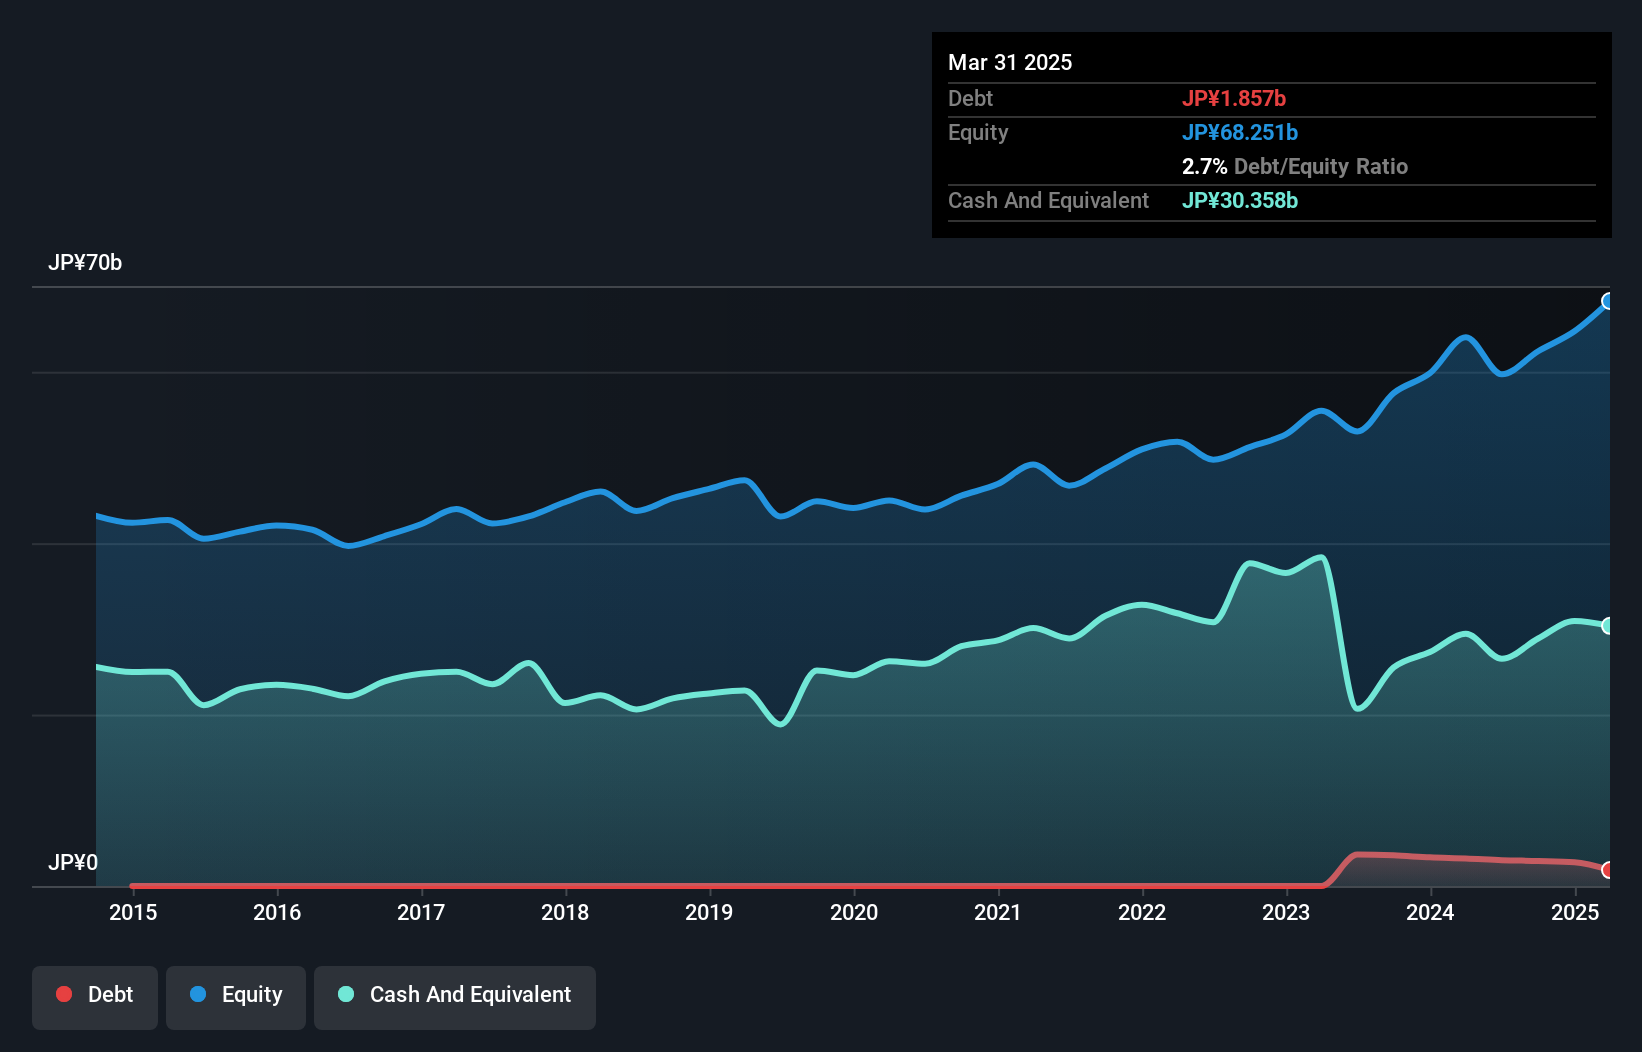
Overview: NSD Co., Ltd. offers a range of IT solutions in Japan and has a market capitalization of approximately ¥211.94 billion.
Operations: NSD Co., Ltd. generates revenue primarily through its System Development Business, with significant contributions from Financial IT (¥36.30 billion), Industrial IT (¥28.44 billion), and Social Infrastructure IT (¥24.63 billion). The Solution Business adds ¥18.37 billion to the total revenue stream, while the IT Infrastructure Construction segment contributes ¥13.54 billion.
NSD Co., Ltd., a nimble player in the IT sector, showcased robust earnings growth of 12.2% over the past year, outpacing the industry average of 11.9%. The company is debt-free, enhancing its financial flexibility and reducing interest payment concerns. Trading at approximately 21.8% below its estimated fair value, NSD presents an attractive opportunity compared to peers. Recent results for Q1 2026 revealed sales of ¥29.93 billion and net income of ¥2.51 billion, marking a solid increase from last year’s figures. Additionally, NSD completed a share repurchase program worth ¥558 million this June, reflecting confidence in its market position.
- Delve into the full analysis health report here for a deeper understanding of NSD.
Review our historical performance report to gain insights into NSD's's past performance.
Turning Ideas Into Actions
- Take a closer look at our Asian Undiscovered Gems With Strong Fundamentals list of 118 companies by clicking here.
- Invested in any of these stocks? Simplify your portfolio management with Simply Wall St and stay ahead with our alerts for any critical updates on your stocks.
- Simply Wall St is a revolutionary app designed for long-term stock investors, it's free and covers every market in the world.
Contemplating Other Strategies?
- Explore high-performing small cap companies that haven't yet garnered significant analyst attention.
- Fuel your portfolio with companies showing strong growth potential, backed by optimistic outlooks both from analysts and management.
- Find companies with promising cash flow potential yet trading below their fair value.
This article by Simply Wall St is general in nature. We provide commentary based on historical data and analyst forecasts only using an unbiased methodology and our articles are not intended to be financial advice. It does not constitute a recommendation to buy or sell any stock, and does not take account of your objectives, or your financial situation. We aim to bring you long-term focused analysis driven by fundamental data. Note that our analysis may not factor in the latest price-sensitive company announcements or qualitative material. Simply Wall St has no position in any stocks mentioned.
Have feedback on this article? Concerned about the content? Get in touch with us directly. Alternatively, email editorial-team@simplywallst.com