


TSX Stocks Estimated To Be Undervalued For August 2026
As the Canadian market navigates through a period of resilient economic growth and solid earnings, investors are keenly observing the potential impacts of fluctuating energy prices and monetary policy adjustments. In this environment, identifying undervalued stocks becomes crucial as they offer opportunities to capitalize on broader market dynamics while potentially benefiting from stable earnings growth and consumer spending trends.
Top 10 Undervalued Stocks Based On Cash Flows In Canada
| Name | Current Price | Fair Value (Est) | Discount (Est) |
| Wesdome Gold Mines (TSX:WDO) | CA$28.28 | CA$51.58 | 45.2% |
| TFI International (TSX:TFII) | CA$199.26 | CA$382.34 | 47.9% |
| SSR Mining (TSX:SSRM) | CA$37.45 | CA$74.01 | 49.4% |
| Medexus Pharmaceuticals (TSX:MDP) | CA$4.99 | CA$9.18 | 45.7% |
| Mattr (TSX:MATR) | CA$17.46 | CA$34.53 | 49.4% |
| Groupe Dynamite (TSX:GRGD) | CA$60.64 | CA$116.95 | 48.1% |
| Gildan Activewear (TSX:GIL) | CA$79.79 | CA$146.24 | 45.4% |
| Constellation Software (TSX:CSU) | CA$3224.99 | CA$6289.03 | 48.7% |
| Chemtrade Logistics Income Fund (TSX:CHE.UN) | CA$16.28 | CA$29.21 | 44.3% |
| Aritzia (TSX:ATZ) | CA$140.21 | CA$251.35 | 44.2% |
Let's dive into some prime choices out of the screener.
Groupe Dynamite (TSX:GRGD)
Overview: Groupe Dynamite Inc. designs, distributes, and sells women's apparel under the Dynamite and Garage brand names across Canada, the United Kingdom, and the United States with a market cap of CA$6.17 billion.
Operations: The company's revenue from the retail apparel segment is CA$1.39 billion.
Estimated Discount To Fair Value: 48.1%
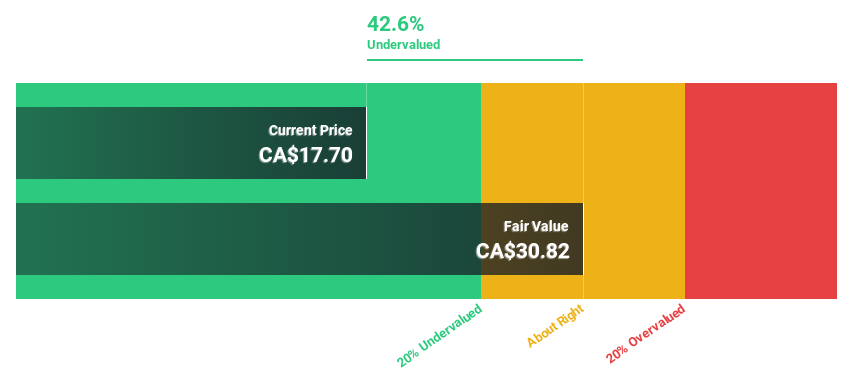
Groupe Dynamite Inc. appears undervalued, trading at CA$60.64, significantly below its estimated future cash flow value of CA$116.95. The company reported strong earnings growth of 98.7% year-over-year and forecasts revenue growth of 14.6% annually, outpacing the Canadian market average. Despite recent share price volatility, analysts predict a potential price rise of 47.1%. Recent board additions emphasize strategic focus on AI-driven enterprise reinvention, potentially enhancing long-term profitability and shareholder value.
- Our comprehensive growth report raises the possibility that Groupe Dynamite is poised for substantial financial growth.
- Click here and access our complete balance sheet health report to understand the dynamics of Groupe Dynamite.
SSR Mining (TSX:SSRM)
Overview: SSR Mining Inc. is involved in the acquisition, exploration, and development of precious metal resource properties across the United States, Türkiye, Canada, and Argentina, with a market cap of approximately CA$7.44 billion.
Operations: The company's revenue is derived from its operations at Puna ($550.47 million), Seabee ($131.28 million), Marigold ($611.02 million), and Cripple Creek & Victor Gold Mine (CC&V) ($602.02 million).
Estimated Discount To Fair Value: 49.4%
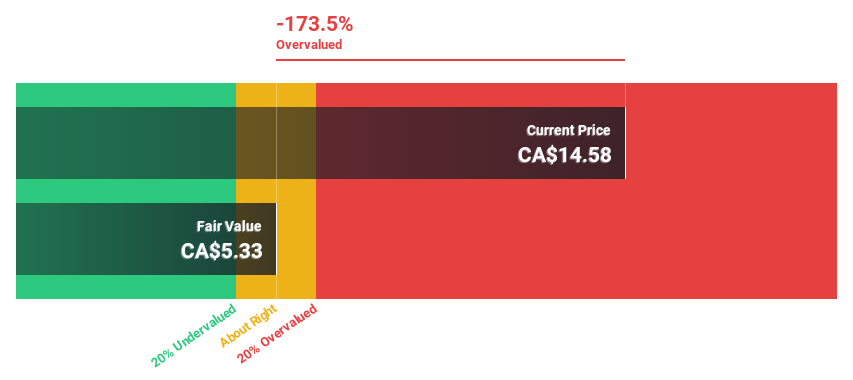
SSR Mining is trading at CA$37.45, significantly below its estimated future cash flow value of CA$74.01, suggesting it is undervalued. Analysts agree on a potential price rise of 49.9%. Despite recent production challenges and a net loss in the first half of 2026, earnings are forecast to grow faster than the Canadian market at 18.4% annually, supported by robust credit facilities and consistent dividend payouts enhancing investor confidence.
- The growth report we've compiled suggests that SSR Mining's future prospects could be on the up.
- Click here to discover the nuances of SSR Mining with our detailed financial health report.
Toromont Industries (TSX:TIH)
Overview: Toromont Industries Ltd. is a company that supplies specialized capital equipment across Canada, the United States, and internationally, with a market capitalization of CA$17.20 billion.
Operations: The company generates revenue from two primary segments: CIMCO, contributing CA$525.52 million, and the Equipment Group, which accounts for CA$5.04 billion.
Estimated Discount To Fair Value: 21.2%
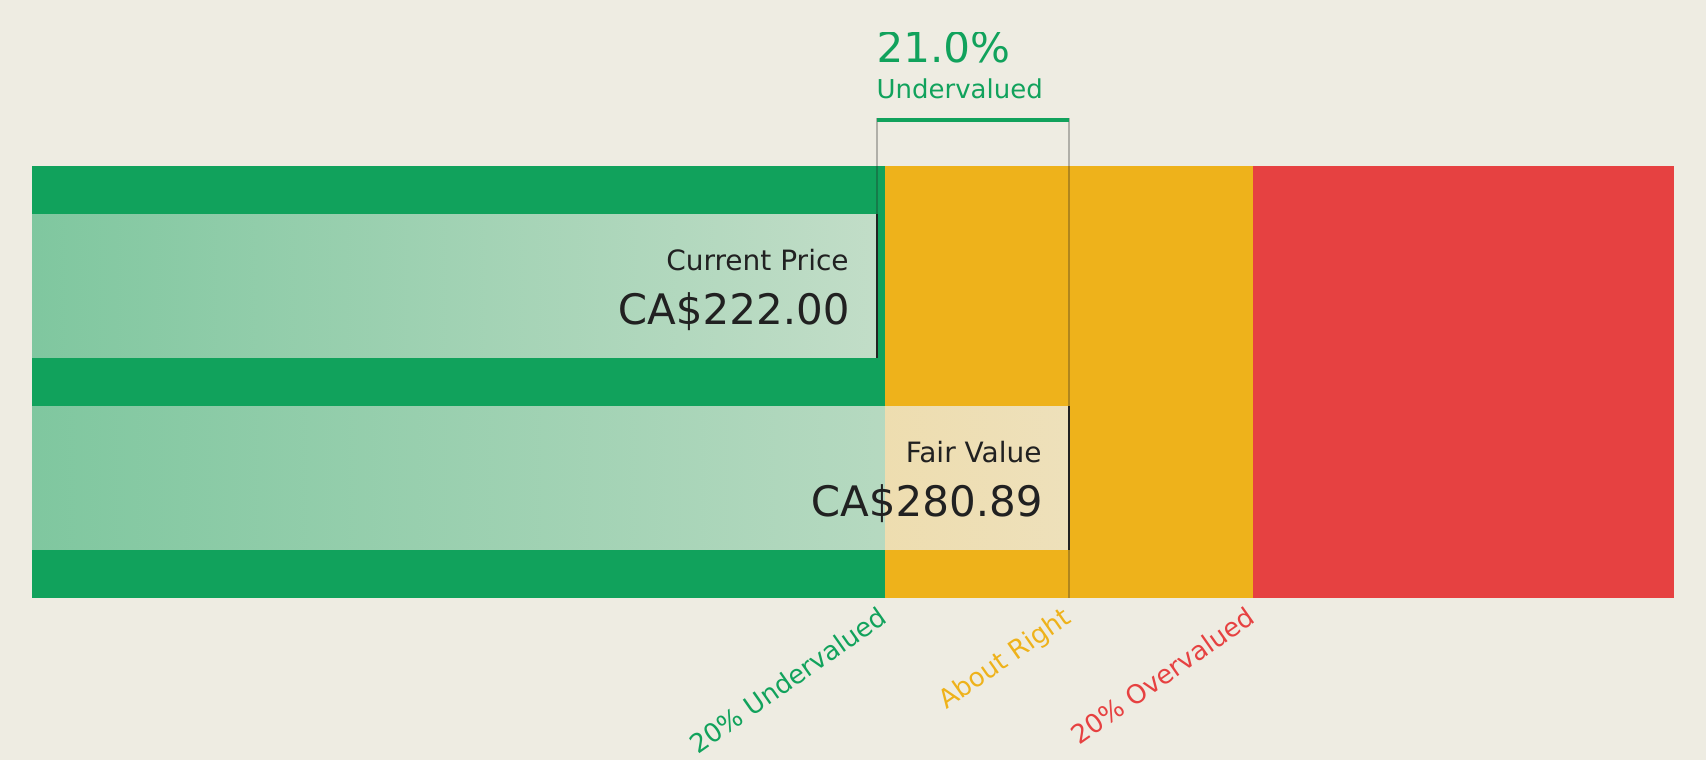
Toromont Industries, trading at CA$221.93, is undervalued compared to its estimated future cash flow value of CA$281.46. The company's earnings are forecast to grow 21.7% annually, outpacing the Canadian market's growth rate of 10.8%. Recent earnings reports show steady revenue growth with sales reaching CA$1.60 billion in Q2 2026 from CA$1.38 billion a year ago, while strategic expansions and solid order backlogs bolster future prospects despite current valuation gaps.
- The analysis detailed in our Toromont Industries growth report hints at robust future financial performance.
- Navigate through the intricacies of Toromont Industries with our comprehensive financial health report here.
Make It Happen
- Take a closer look at our Undervalued TSX Stocks Based On Cash Flows list of 29 companies by clicking here.
- Are these companies part of your investment strategy? Use Simply Wall St to consolidate your holdings into a portfolio and gain insights with our comprehensive analysis tools.
- Enhance your investing ability with the Simply Wall St app and enjoy free access to essential market intelligence spanning every continent.
Interested In Other Possibilities?
- Explore high-performing small cap companies that haven't yet garnered significant analyst attention.
- Diversify your portfolio with solid dividend payers offering reliable income streams to weather potential market turbulence.
- Fuel your portfolio with companies showing strong growth potential, backed by optimistic outlooks both from analysts and management.
This article by Simply Wall St is general in nature. We provide commentary based on historical data and analyst forecasts only using an unbiased methodology and our articles are not intended to be financial advice. It does not constitute a recommendation to buy or sell any stock, and does not take account of your objectives, or your financial situation. We aim to bring you long-term focused analysis driven by fundamental data. Note that our analysis may not factor in the latest price-sensitive company announcements or qualitative material. Simply Wall St has no position in any stocks mentioned.
Have feedback on this article? Concerned about the content? Get in touch with us directly. Alternatively, email editorial-team@simplywallst.com