


TD SYNNEX (SNX) Stock Looks Near Fair Value After A Strong Run
TD SYNNEX stock has delivered very strong gains over the last few years, yet current checks suggest it now sits close to its estimated intrinsic value based on a Discounted Cash Flow (DCF) framework, while traditional earnings based multiples still lean toward an undervalued read.
- Over the last 3 years TD SYNNEX has returned about 176%, which puts extra focus on whether recent price strength already reflects the fundamentals.
- The build out of TD SYNNEX's cybersecurity offering, including its cyber range training platform discussed at Cyber Live Arizona, can support expectations for future cash flows. At the same time, execution risk in scaling these solutions and integrating new technologies remains a key uncertainty for valuation.
- TD SYNNEX scores highly on the broader checks, with a value score of 5 out of 6, which suggests the stock still screens as relatively attractive on several valuation measures.
The issue now is whether TD SYNNEX's strong share price performance has mostly closed the gap to intrinsic value or if there is still a meaningful valuation cushion left for new investors.
Where Does TD SYNNEX Sit on Cash Flow?
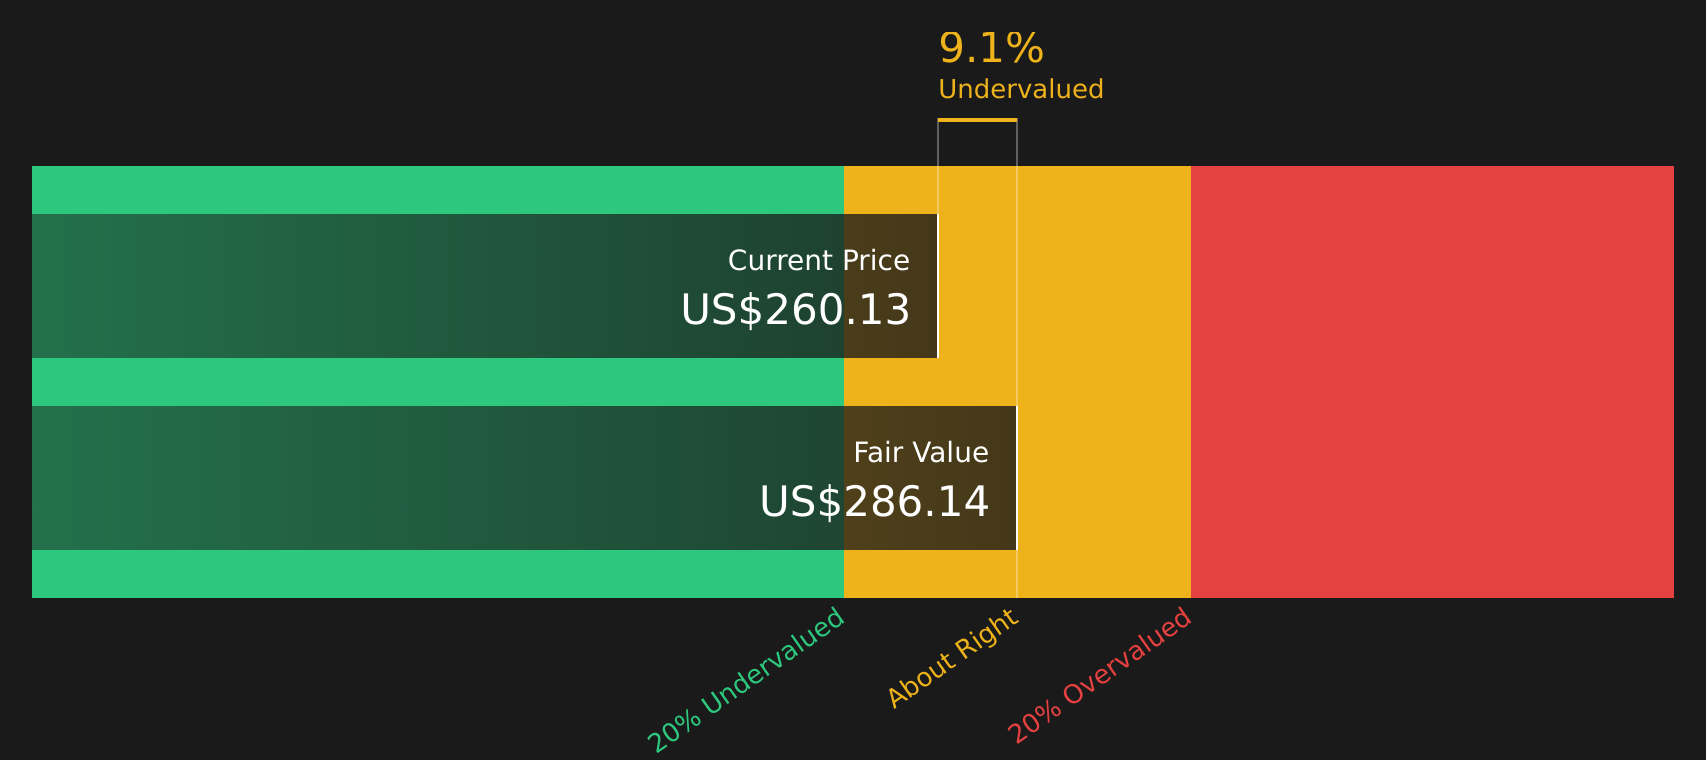
The Discounted Cash Flow model for TD SYNNEX uses projected cash flows to estimate what the stock might be worth today. On this view, the company is valued using a 2 stage free cash flow to equity approach that starts from latest twelve month free cash flow of about $357.7 million. The projections assume growing cash flows over time and point to an intrinsic value of about $284 per share in $ terms.
Compared with the current share price, this implies TD SYNNEX trades at roughly a 7.3% discount to that DCF estimate, so it screens as slightly undervalued on this cash flow view. The recent focus on its cyber range training and broader cybersecurity offering helps explain why the market is willing to price in ongoing cash generation, even if execution around scaling these solutions remains an open question.
On the DCF numbers, TD SYNNEX stock looks roughly fairly valued, with only a modest discount to estimated intrinsic value.
TD SYNNEX is fairly valued according to our Discounted Cash Flow (DCF), but this can change at a moment's notice. Track the value in your watchlist or portfolio and be alerted on when to act.
Does TD SYNNEX Look Undervalued on Earnings?
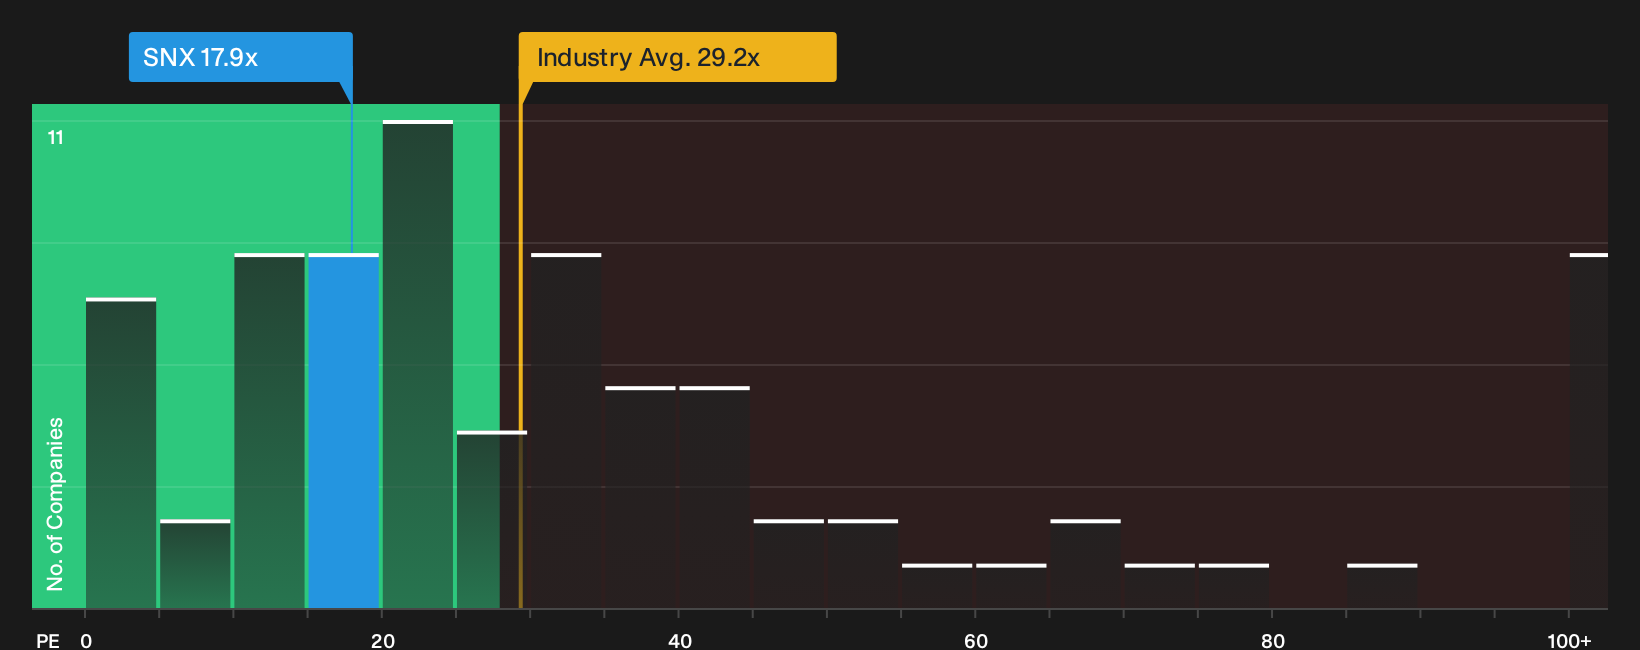
The P/E ratio fits TD SYNNEX well because earnings remain a key anchor for investors in a mature distribution and services business. Right now the stock trades on a P/E of about 18.7x. That sits below both the peer average of 21.4x and the wider electronic industry average of 32.5x, which means the market is paying less for each dollar of TD SYNNEX earnings than it is for many similar companies.
The tailored fair P/E ratio for TD SYNNEX, which considers its size, margins and risk profile, is about 26.8x. That is meaningfully higher than the current 18.7x multiple. This gap suggests the stock trades at a discount to what investors might reasonably pay for its earnings based on those fundamentals.
On the P/E lens, TD SYNNEX stock looks undervalued relative to both tailored and sector benchmarks.
See what the numbers say about this price — find out in our valuation breakdown.
The TD SYNNEX Narrative: What Would Justify Today's Price?
Simply Wall St Narratives for TD SYNNEX pick up where this valuation puzzle leaves off and spell out which combinations of future growth, margins and earnings would need to play out for the stock to be worth materially more or less than today’s price on the Community page. Rather than relying on a single multiple or model result, each narrative lays out the assumptions that sit behind its fair value so you can compare them with TD SYNNEX's actual results over time.
One of the top community narratives on TD SYNNEX: 7% undervalued
"Hyve is concentrating a very large portion of its non GAAP gross billings in two main hyperscale customers, which could quickly pressure Hyve gross billings and associated operating income contribution if their AI data center infrastructure programs slow or their in house build strategies change."
Read one of the top narratives on TD SYNNEX
Do you think there's more to the story for TD SYNNEX? Head over to our Community to see what others are saying!
The Bottom Line
For TD SYNNEX, the Discounted Cash Flow (DCF) intrinsic value estimate points to a stock that is roughly fairly valued with only a modest discount left. The earnings multiple view still screens the shares as undervalued relative to peers, which keeps the case open that the market is not fully pricing in its earnings power. With broader checks scoring well, the real hinge now is whether TD SYNNEX can execute on its cybersecurity and broader solutions push without eroding returns. That execution question will likely decide whether the current discount is a genuine opportunity or a fair reflection of risk.
This article by Simply Wall St is general in nature. We provide commentary based on historical data and analyst forecasts only using an unbiased methodology and our articles are not intended to be financial advice. It does not constitute a recommendation to buy or sell any stock, and does not take account of your objectives, or your financial situation. We aim to bring you long-term focused analysis driven by fundamental data. Note that our analysis may not factor in the latest price-sensitive company announcements or qualitative material. Simply Wall St has no position in any stocks mentioned.
Have feedback on this article? Concerned about the content? Get in touch with us directly. Alternatively, email editorial-team@simplywallst.com