


Asian Stocks Trading Below Estimated Value In July 2026
As the Asian markets navigate a complex landscape of geopolitical tensions and fluctuating oil prices, investors are increasingly focused on identifying opportunities that may be trading below their intrinsic value. In this environment, stocks that demonstrate strong fundamentals and resilience to external pressures can present compelling prospects for those looking to capitalize on potential undervaluation.
Top 10 Undervalued Stocks Based On Cash Flows In Asia
| Name | Current Price | Fair Value (Est) | Discount (Est) |
| Sichuan Kelun-Biotech Biopharmaceutical (SEHK:6990) | HK$497.60 | HK$979.14 | 49.2% |
| Pan-United (SGX:P52) | SGD1.62 | SGD3.15 | 48.6% |
| OVERLAP HoldingsInc (TSE:414A) | ¥846.00 | ¥1661.73 | 49.1% |
| Innostar Service (TPEX:7828) | NT$1290.00 | NT$2560.19 | 49.6% |
| Fositek (TWSE:6805) | NT$1265.00 | NT$2525.62 | 49.9% |
| CSPC Innovation Pharmaceutical (SZSE:300765) | CN¥38.00 | CN¥74.24 | 48.8% |
| CanSino Biologics (SEHK:6185) | HK$23.64 | HK$45.95 | 48.6% |
| BuySell TechnologiesLtd (TSE:7685) | ¥3025.00 | ¥5874.18 | 48.5% |
| BEAUTY GARAGE (TSE:3180) | ¥1445.00 | ¥2873.61 | 49.7% |
| Accton Technology (TWSE:2345) | NT$1910.00 | NT$3800.79 | 49.7% |
Let's uncover some gems from our specialized screener.
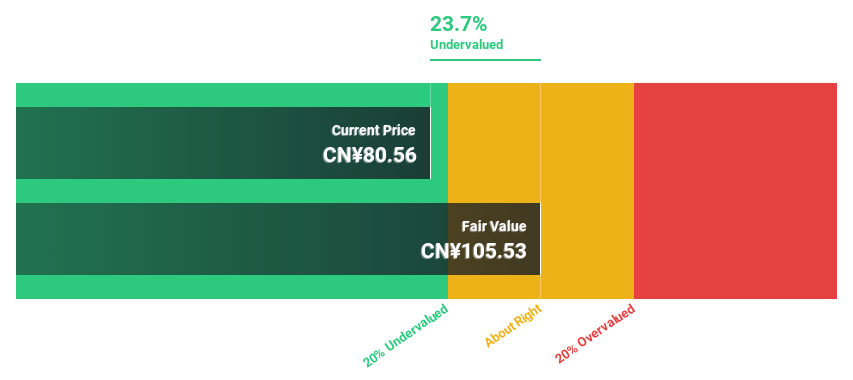
Nanjing LES Information Technology (SHSE:688631)
Overview: Nanjing LES Information Technology Co., Ltd. operates in the information technology sector and has a market cap of approximately CN¥6.57 billion.
Operations: Unfortunately, the Business operations text you provided does not contain specific revenue segment details for Nanjing LES Information Technology Co., Ltd. If you have additional information regarding their revenue segments, please share it so I can assist further.
Estimated Discount To Fair Value: 35.9%
Nanjing LES Information Technology is trading at CN¥40.22, significantly below its estimated future cash flow value of CN¥62.71, indicating it is undervalued by over 35%. Earnings are forecast to grow 42.6% annually, outpacing the Chinese market's growth rate of 25.7%. However, profit margins have declined from 8.8% to 4.6%, and return on equity is expected to be low at 10% in three years despite strong revenue growth projections of 27.3%.
- Insights from our recent growth report point to a promising forecast for Nanjing LES Information Technology's business outlook.
- Delve into the full analysis health report here for a deeper understanding of Nanjing LES Information Technology.
Hangzhou Turbine Power Group (SZSE:300277)
Overview: Hangzhou Turbine Power Group Co., Ltd. is involved in power information system integration in China and has a market cap of CN¥17.58 billion.
Operations: The company generates revenue from its power information system integration operations in China.
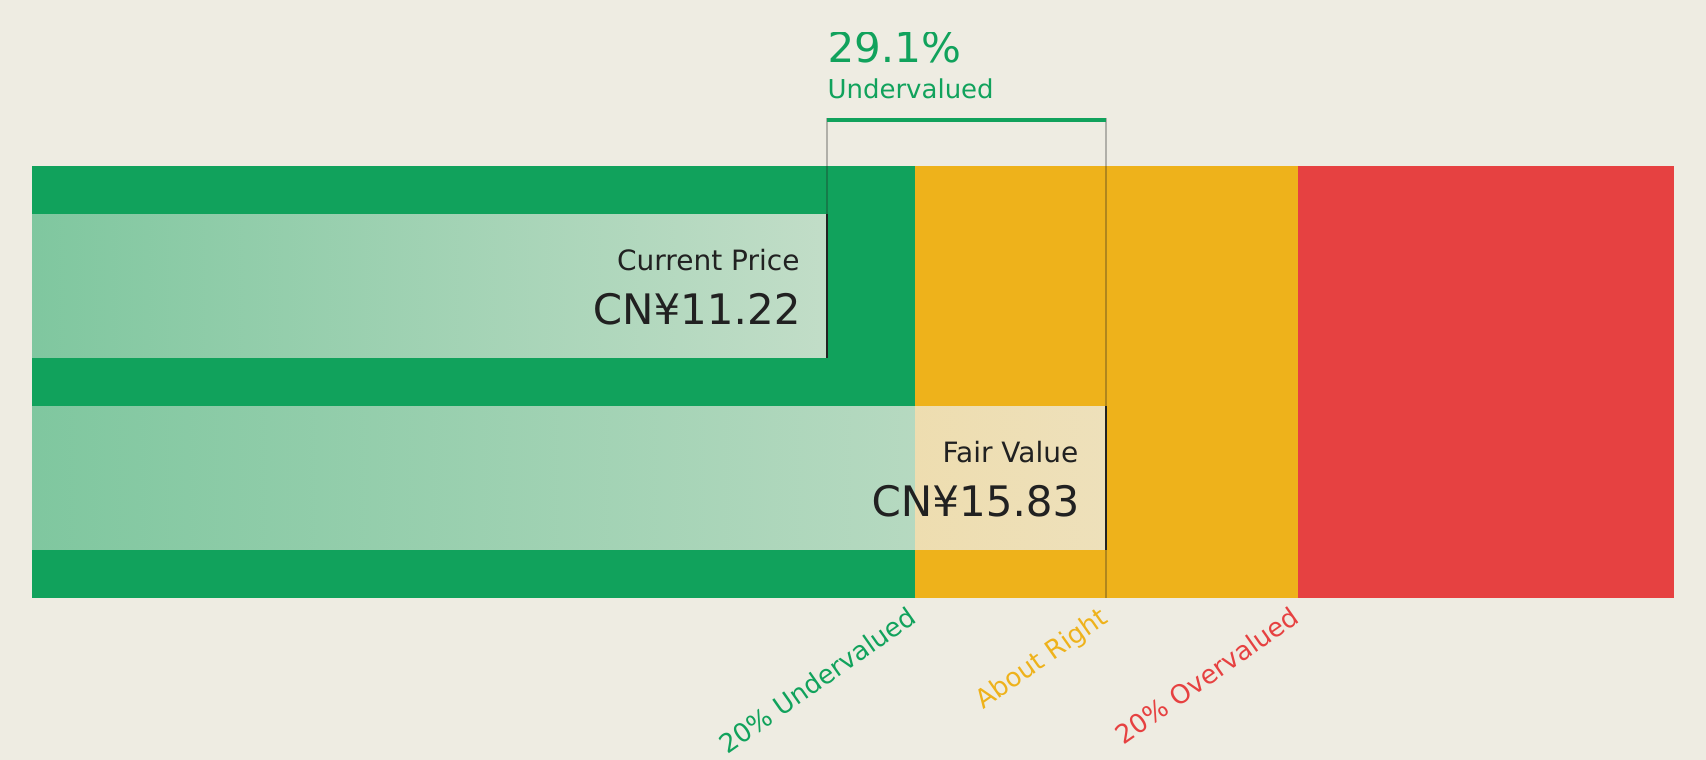
Estimated Discount To Fair Value: 26.4%
Hangzhou Turbine Power Group is trading at CN¥11.59, below its estimated future cash flow value of CN¥15.74, suggesting undervaluation by over 20%. Forecasted revenue growth of 77.6% annually surpasses the Chinese market's 16.2%, and earnings are expected to grow significantly at 77.8% per year, well above the market's 25.7%. Recent inclusion in key indices may enhance visibility despite a recent dividend decrease to CNY0.18 per share for A shares.
- The growth report we've compiled suggests that Hangzhou Turbine Power Group's future prospects could be on the up.
- Take a closer look at Hangzhou Turbine Power Group's balance sheet health here in our report.
Link and Motivation (TSE:2170)
Overview: Link and Motivation Inc. offers consulting and cloud services in Japan, with a market cap of ¥68.61 billion.
Operations: The company's revenue is primarily derived from its Matching Division, which contributes ¥19.95 billion, followed by the Organization Development Division at ¥17.52 billion and the Individual Development Division at ¥5.98 billion.
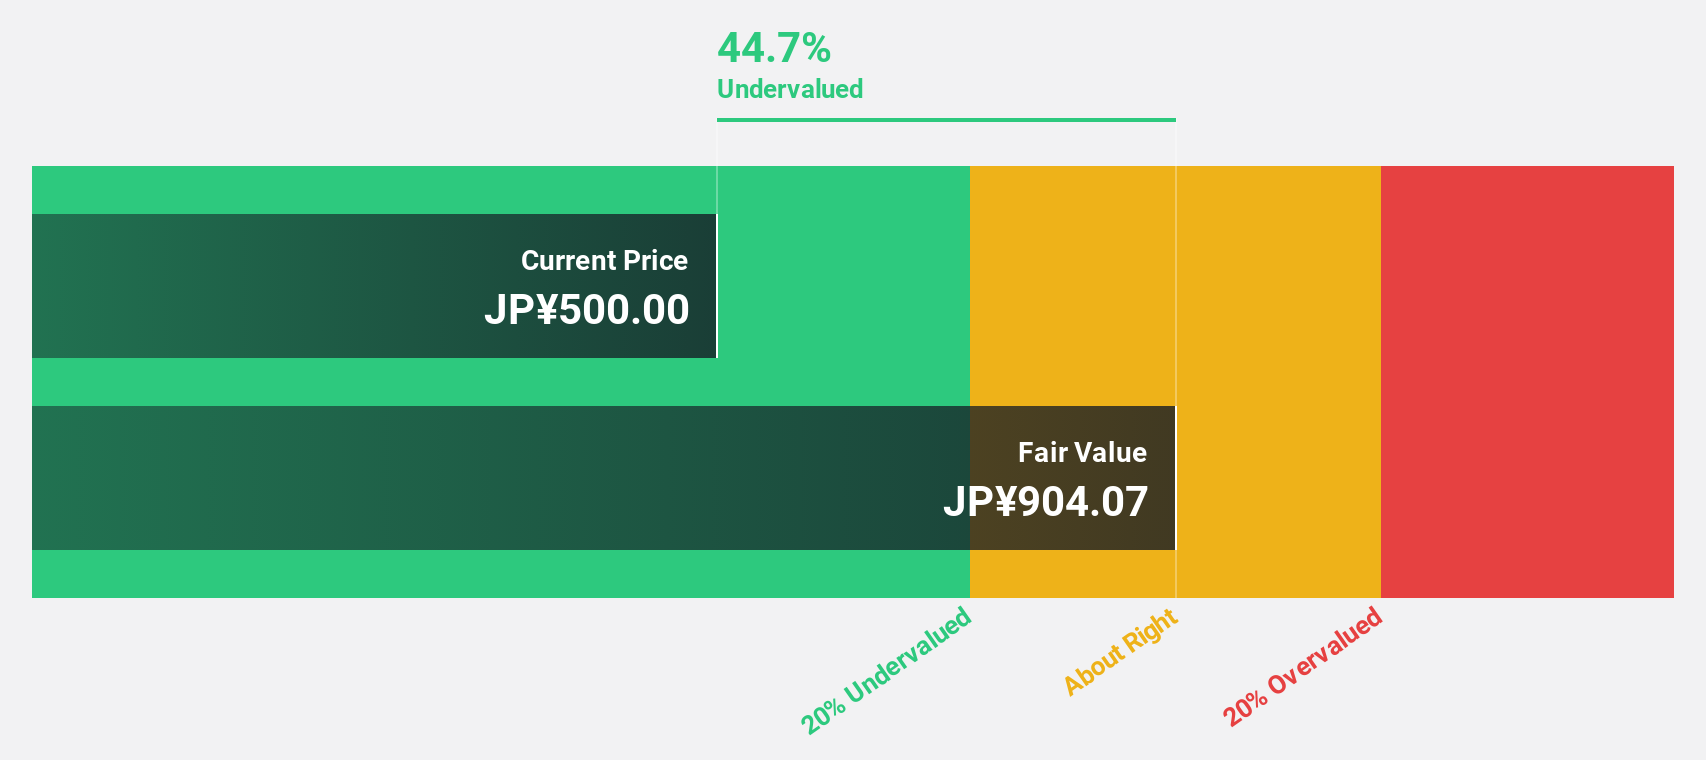
Estimated Discount To Fair Value: 31%
Link and Motivation is trading at ¥644, significantly below its estimated future cash flow value of ¥933.69, indicating undervaluation by over 20%. Despite a high debt level, the company shows strong growth potential with earnings expected to increase by 31.3% annually, outpacing the Japanese market's 9.9%. Recent share buybacks totaling ¥2.5 billion could enhance shareholder value, although profit margins have decreased from last year’s 10.2% to 4.1%.
- Our growth report here indicates Link and Motivation may be poised for an improving outlook.
- Click to explore a detailed breakdown of our findings in Link and Motivation's balance sheet health report.
Summing It All Up
- Delve into our full catalog of 212 Undervalued Asian Stocks Based On Cash Flows here.
- Already own these companies? Bring clarity to your investment decisions by linking up your portfolio with Simply Wall St, where you can monitor all the vital signs of your stocks effortlessly.
- Simply Wall St is your key to unlocking global market trends, a free user-friendly app for forward-thinking investors.
Searching for a Fresh Perspective?
- Explore high-performing small cap companies that haven't yet garnered significant analyst attention.
- Diversify your portfolio with solid dividend payers offering reliable income streams to weather potential market turbulence.
- Fuel your portfolio with companies showing strong growth potential, backed by optimistic outlooks both from analysts and management.
This article by Simply Wall St is general in nature. We provide commentary based on historical data and analyst forecasts only using an unbiased methodology and our articles are not intended to be financial advice. It does not constitute a recommendation to buy or sell any stock, and does not take account of your objectives, or your financial situation. We aim to bring you long-term focused analysis driven by fundamental data. Note that our analysis may not factor in the latest price-sensitive company announcements or qualitative material. Simply Wall St has no position in any stocks mentioned.
Have feedback on this article? Concerned about the content? Get in touch with us directly. Alternatively, email editorial-team@simplywallst.com