


European Market Stocks Estimated To Be Trading At A Discount
As European markets navigate a landscape marked by robust corporate earnings, geopolitical tensions, and fluctuating oil prices, investors are keenly observing opportunities within the pan-European STOXX Europe 600 Index and other major indices. In this environment, identifying undervalued stocks becomes crucial as these may offer potential value to investors seeking to capitalize on current market conditions.
Top 10 Undervalued Stocks Based On Cash Flows In Europe
| Name | Current Price | Fair Value (Est) | Discount (Est) |
| VIGO Photonics (WSE:VGO) | PLN482.00 | PLN962.88 | 49.9% |
| Stille (OM:STIL) | SEK237.00 | SEK460.16 | 48.5% |
| Nordisk Bergteknik (OM:NORB B) | SEK11.35 | SEK22.68 | 50% |
| Modulight Oyj (HLSE:MODU) | €1.055 | €2.08 | 49.3% |
| JOST Werke (XTRA:JST) | €56.80 | €112.90 | 49.7% |
| Hensoldt (XTRA:HAG) | €84.38 | €167.24 | 49.5% |
| ERAMET (ENXTPA:ERA) | €42.18 | €83.52 | 49.5% |
| Dynavox Group (OM:DYVOX) | SEK74.95 | SEK148.01 | 49.4% |
| Dustin Group (OM:DUST) | SEK1.846 | SEK3.58 | 48.4% |
| Alimak Group (OM:ALIG) | SEK126.20 | SEK250.59 | 49.6% |
Here's a peek at a few of the choices from the screener.
General Oceans (OB:GENO)
Overview: General Oceans ASA is a company that develops and manufactures oceanographic sensors, underwater vehicle systems, robotic manipulators, and software in Norway and internationally, with a market cap of NOK4.04 billion.
Operations: The company's revenue is primarily derived from its Sensors segment, which generated NOK1.07 billion, followed by the Robotics segment with NOK218.47 million.
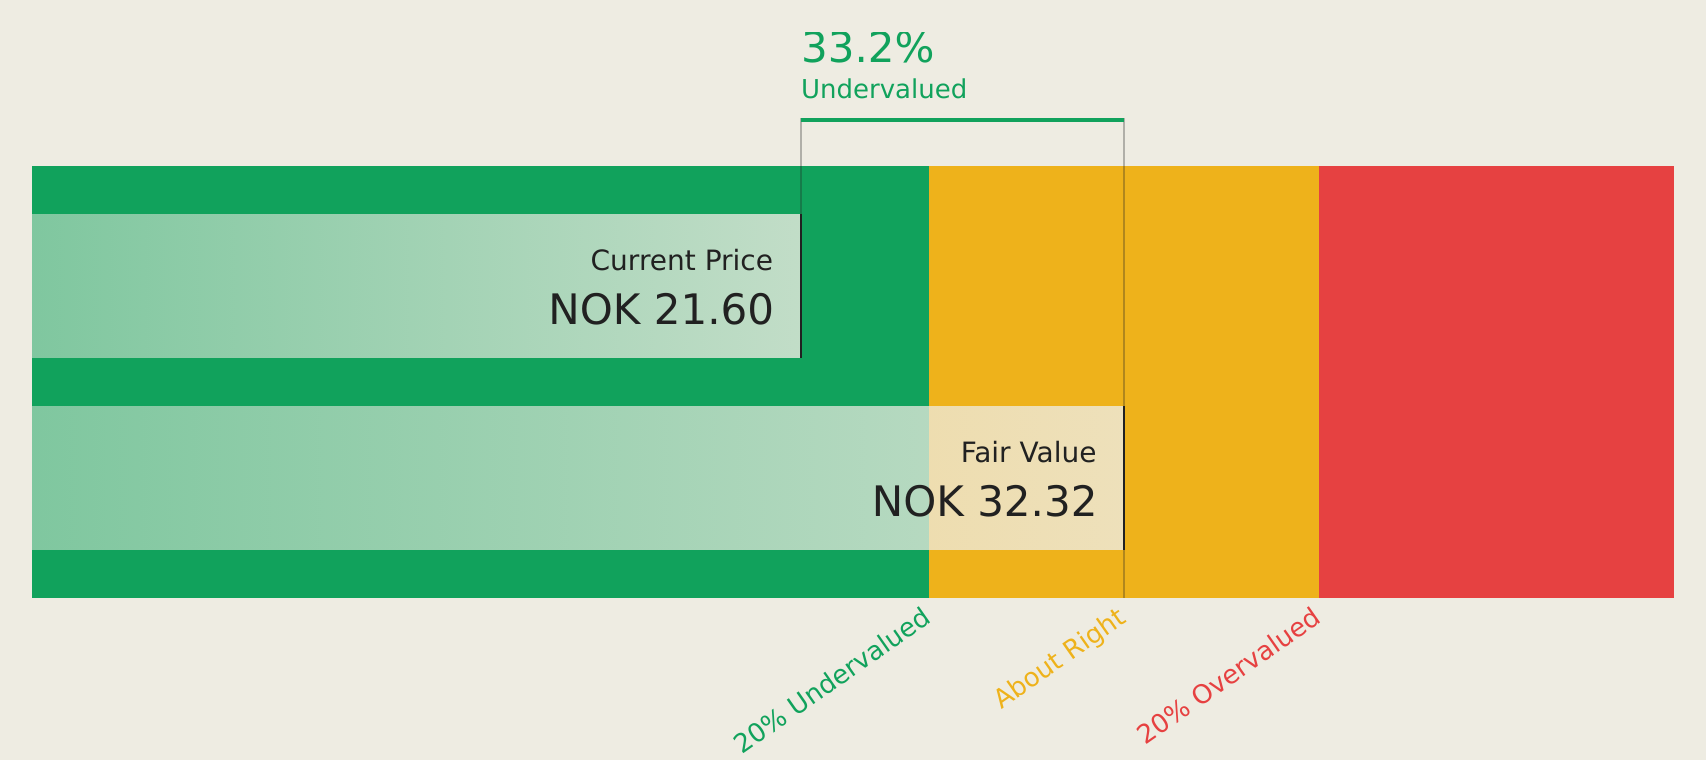
Estimated Discount To Fair Value: 34%
General Oceans is trading at NOK21.25, significantly below its estimated future cash flow value of NOK32.19, indicating undervaluation based on cash flows. Its earnings are expected to grow by 20.2% annually, outpacing the Norwegian market's growth rate of 7.7%. Despite a recent dip in quarterly sales and net income, General Oceans continues to show strong potential with forecasted revenue growth of 12.4% per year and significant earnings expansion over the next three years.
- The analysis detailed in our General Oceans growth report hints at robust future financial performance.
- Click here to discover the nuances of General Oceans with our detailed financial health report.
Paradox Interactive (OM:PDX)
Overview: Paradox Interactive AB (publ) is a developer and publisher of strategy and management games for PC and consoles, operating in the United States, Europe, Sweden, and globally, with a market cap of approximately SEK14.12 billion.
Operations: The company generates revenue of SEK2.16 billion from its computer graphics segment.
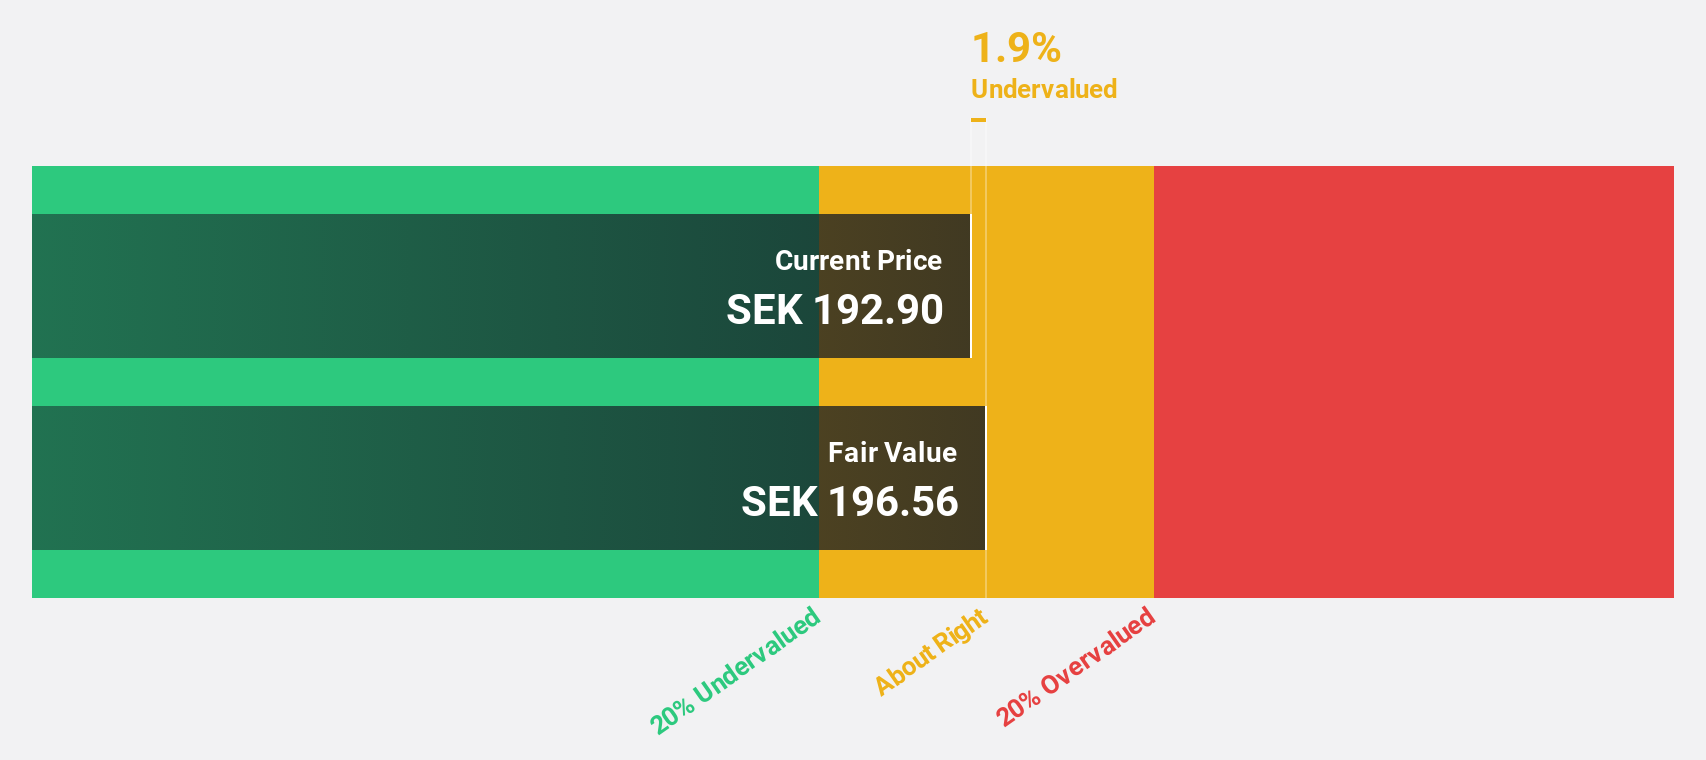
Estimated Discount To Fair Value: 14.1%
Paradox Interactive is trading at SEK133.7, slightly below its estimated future cash flow value of SEK155.72, suggesting modest undervaluation. Despite a drop in profit margins from 26.6% to 4.1%, earnings are forecasted to grow significantly at 42.6% annually, outpacing the Swedish market's growth rate of 7.1%. Recent product releases like Transport Fever 3 and Stellaris: Nomads could bolster revenue growth, which is expected to exceed the Swedish market average despite slower overall revenue expansion at 5.3%.
- Our growth report here indicates Paradox Interactive may be poised for an improving outlook.
- Get an in-depth perspective on Paradox Interactive's balance sheet by reading our health report here.
secunet Security Networks (XTRA:YSN)
Overview: secunet Security Networks Aktiengesellschaft is a cybersecurity company operating in Germany and internationally, with a market cap of approximately €1.07 billion.
Operations: The company generates revenue from two main segments: the Public Sector, contributing €420.82 million, and the Business Sector, which accounts for €41.32 million.
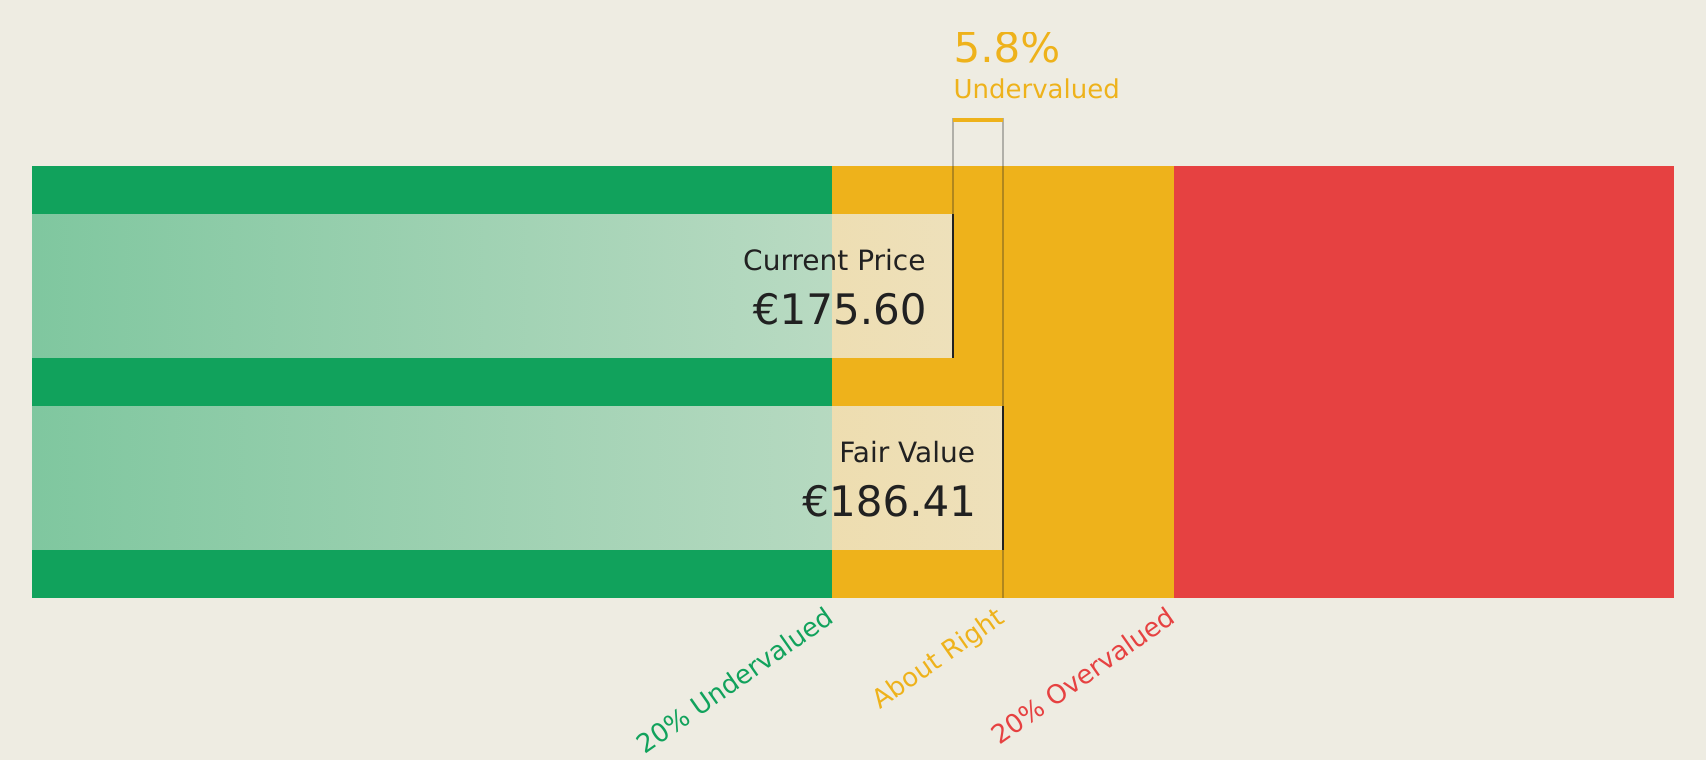
Estimated Discount To Fair Value: 10.7%
secunet Security Networks is trading at €166, slightly below its estimated future cash flow value of €185.86, indicating modest undervaluation. Earnings are forecast to grow significantly at 20.8% per year, outpacing the German market's growth rate of 15.7%. The company confirmed its revenue guidance for 2026 between €460 million and €500 million despite a recent quarterly net loss of €2.2 million compared to a profit last year.
- The growth report we've compiled suggests that secunet Security Networks' future prospects could be on the up.
- Click to explore a detailed breakdown of our findings in secunet Security Networks' balance sheet health report.
Make It Happen
- Unlock more gems! Our Undervalued European Stocks Based On Cash Flows screener has unearthed 210 more companies for you to explore.Click here to unveil our expertly curated list of 213 Undervalued European Stocks Based On Cash Flows.
- Invested in any of these stocks? Simplify your portfolio management with Simply Wall St and stay ahead with our alerts for any critical updates on your stocks.
- Simply Wall St is your key to unlocking global market trends, a free user-friendly app for forward-thinking investors.
Looking For Alternative Opportunities?
- Explore high-performing small cap companies that haven't yet garnered significant analyst attention.
- Diversify your portfolio with solid dividend payers offering reliable income streams to weather potential market turbulence.
- Fuel your portfolio with companies showing strong growth potential, backed by optimistic outlooks both from analysts and management.
This article by Simply Wall St is general in nature. We provide commentary based on historical data and analyst forecasts only using an unbiased methodology and our articles are not intended to be financial advice. It does not constitute a recommendation to buy or sell any stock, and does not take account of your objectives, or your financial situation. We aim to bring you long-term focused analysis driven by fundamental data. Note that our analysis may not factor in the latest price-sensitive company announcements or qualitative material. Simply Wall St has no position in any stocks mentioned.
Have feedback on this article? Concerned about the content? Get in touch with us directly. Alternatively, email editorial-team@simplywallst.com