


TSX Value Opportunities Featuring Chemtrade Logistics Income Fund And 2 More Stocks Trading Below Estimated Intrinsic Values
As the Canadian market navigates rising oil prices and higher yields, driven by renewed U.S.–Iran tensions, investors are keenly watching how these factors might influence central bank policies and economic stability. In such a climate, identifying stocks trading below their estimated intrinsic values can offer potential opportunities for value-seeking investors.
Top 10 Undervalued Stocks Based On Cash Flows In Canada
| Name | Current Price | Fair Value (Est) | Discount (Est) |
| TFI International (TSX:TFII) | CA$212.43 | CA$386.98 | 45.1% |
| Surge Energy (TSX:SGY) | CA$10.26 | CA$17.85 | 42.5% |
| Stantec (TSX:STN) | CA$95.13 | CA$149.77 | 36.5% |
| Medexus Pharmaceuticals (TSX:MDP) | CA$5.04 | CA$9.20 | 45.2% |
| G Mining Ventures (TSX:GMIN) | CA$43.00 | CA$67.23 | 36% |
| Energy Fuels (TSX:EFR) | CA$15.94 | CA$29.22 | 45.5% |
| Endeavour Silver (TSX:EDR) | CA$11.02 | CA$21.92 | 49.7% |
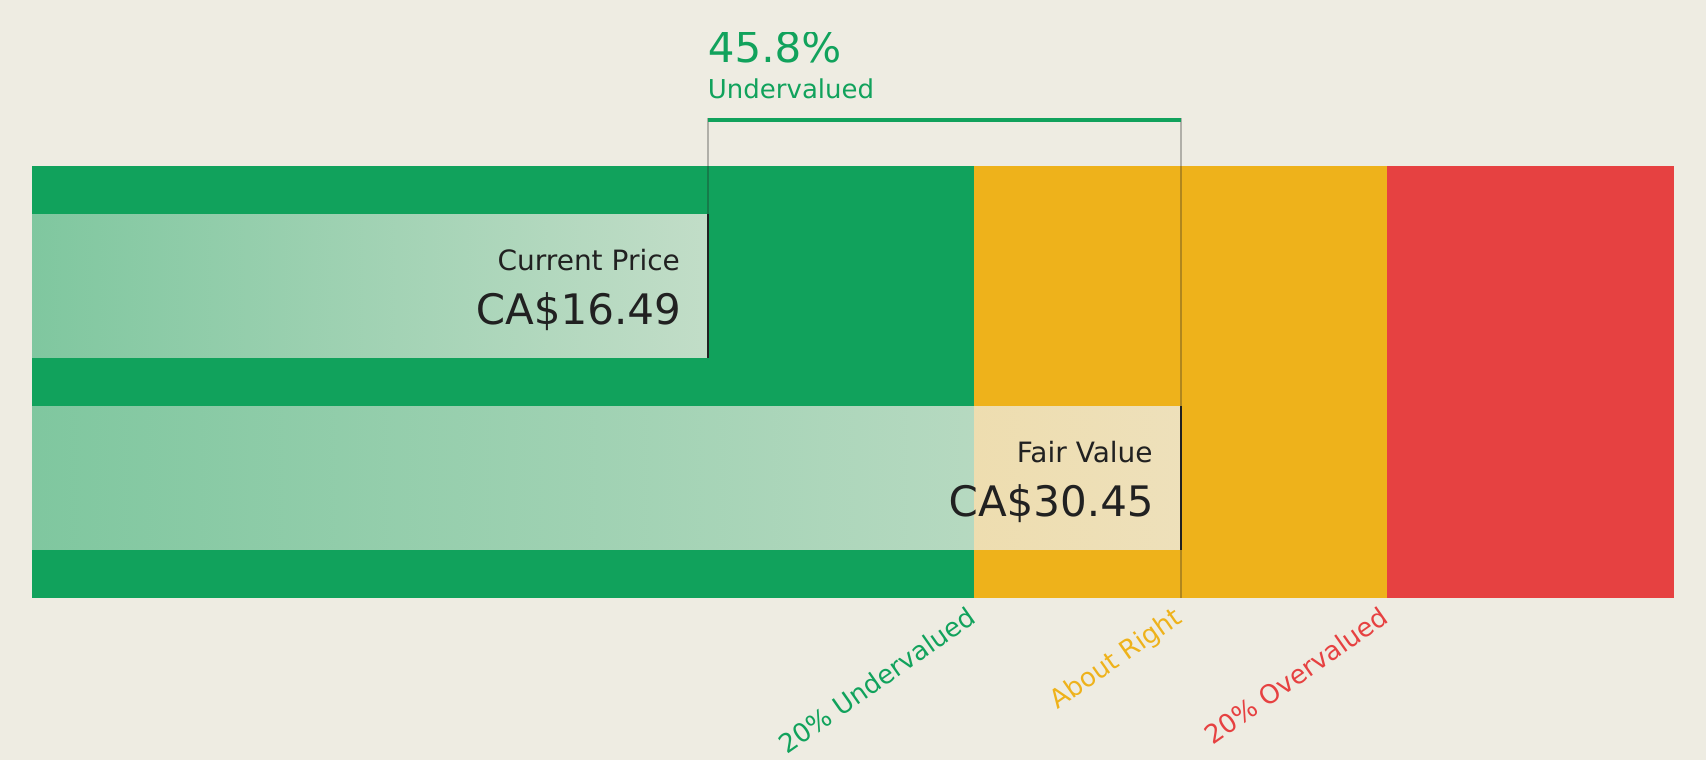
| Chemtrade Logistics Income Fund (TSX:CHE.UN) | CA$16.48 | CA$30.45 | 45.9% |
| Avino Silver & Gold Mines (TSX:ASM) | CA$7.95 | CA$13.14 | 39.5% |
| Aritzia (TSX:ATZ) | CA$134.50 | CA$254.25 | 47.1% |
We're going to check out a few of the best picks from our screener tool.
Chemtrade Logistics Income Fund (TSX:CHE.UN)
Overview: Chemtrade Logistics Income Fund provides industrial chemicals and services across Canada, the United States, and Brazil with a market cap of CA$1.84 billion.
Operations: The company's revenue is primarily derived from its Electrochemicals (EC) segment, which accounts for CA$752.04 million.
Estimated Discount To Fair Value: 45.9%
Chemtrade Logistics Income Fund is trading at CA$16.48, significantly below its estimated future cash flow value of CA$30.45, indicating potential undervaluation based on discounted cash flows. Despite a high debt level and an unstable dividend track record, earnings are expected to grow significantly at 20.9% annually, outpacing the Canadian market's growth rate of 10.9%. Recent share buybacks and consistent dividend declarations underscore management's commitment to shareholder returns amidst strategic acquisition pursuits.
- The growth report we've compiled suggests that Chemtrade Logistics Income Fund's future prospects could be on the up.
- Unlock comprehensive insights into our analysis of Chemtrade Logistics Income Fund stock in this financial health report.
Firan Technology Group (TSX:FTG)
Overview: Firan Technology Group Corporation manufactures and sells aerospace and defense electronic products and subsystems internationally, with a market cap of CA$581.00 million.
Operations: The company's revenue segments include Circuits at CA$128.46 million and Aerospace at CA$74.58 million.
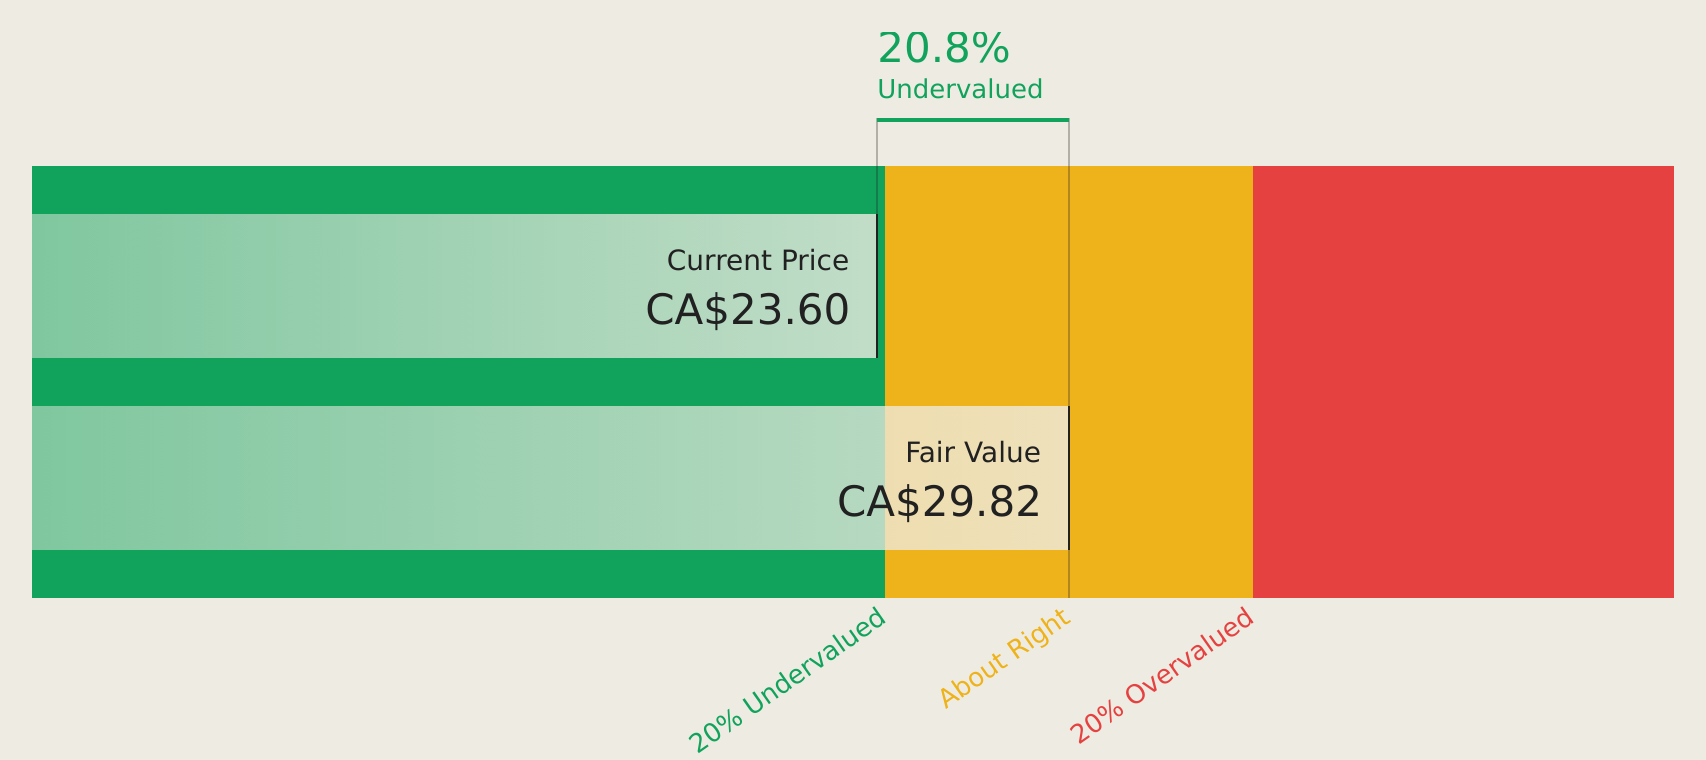
Estimated Discount To Fair Value: 22.6%
Firan Technology Group, trading at CA$23.08, is undervalued based on discounted cash flows with an estimated future value of CA$29.82. Earnings have grown 44.5% annually over five years and are expected to rise significantly at 22% per year, surpassing the Canadian market's growth rate of 10.9%. Recent earnings showed increased sales and net income, while the opening of a new aerospace facility in India expands global market opportunities and aligns with strategic growth initiatives.
- Our comprehensive growth report raises the possibility that Firan Technology Group is poised for substantial financial growth.
- Navigate through the intricacies of Firan Technology Group with our comprehensive financial health report here.
TFI International (TSX:TFII)
Overview: TFI International Inc., along with its subsidiaries, offers transportation and logistics services across the United States, Canada, and Mexico, with a market cap of CA$17.46 billion.
Operations: The company's revenue segments include Logistics ($1.58 billion), Truckload ($3.10 billion), and Less-Than-Truckload ($3.25 billion).
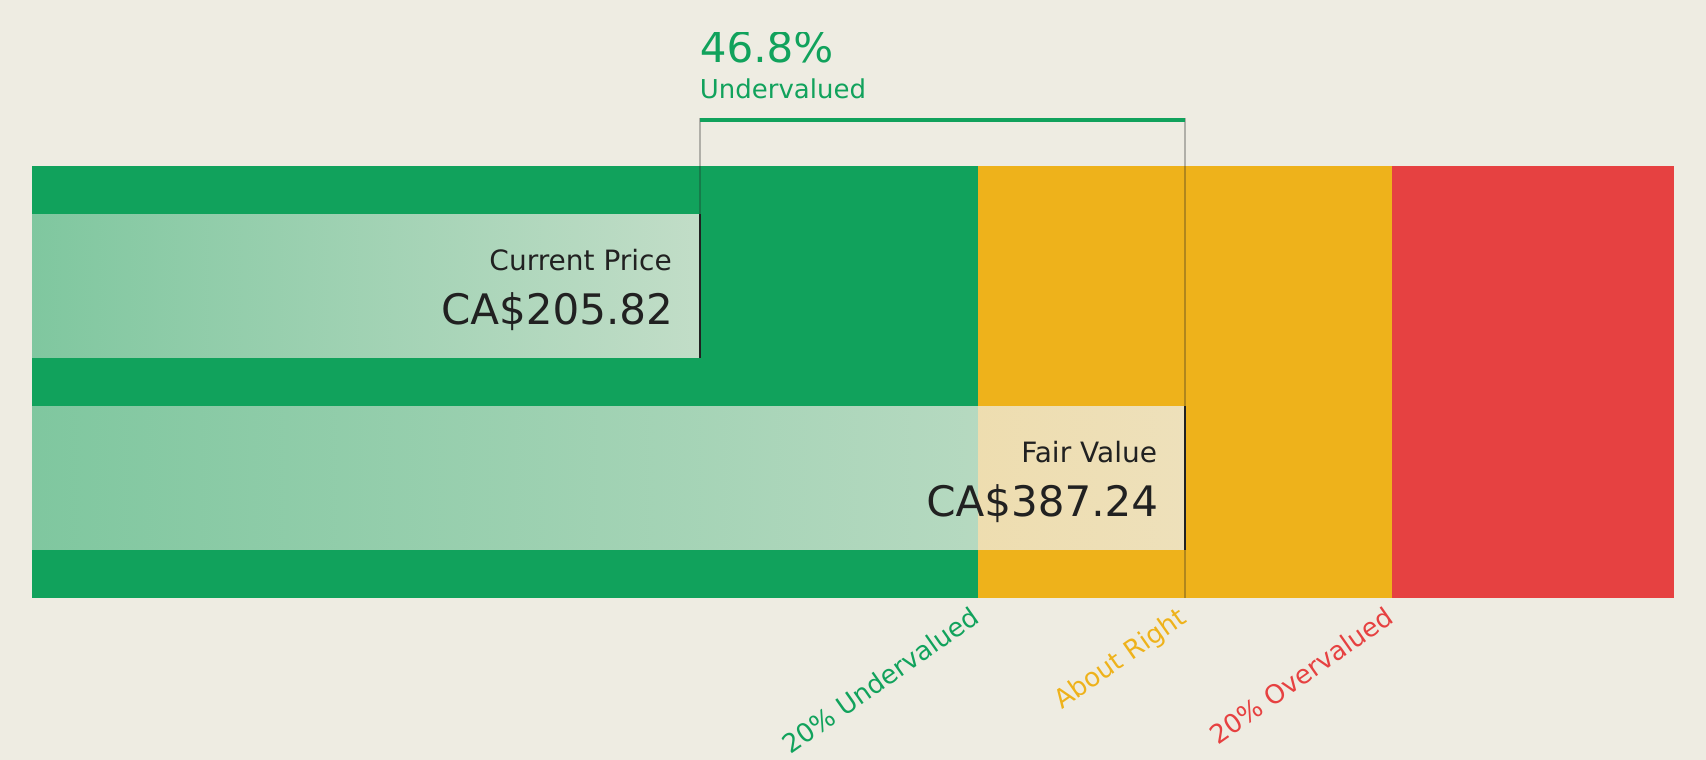
Estimated Discount To Fair Value: 45.1%
TFI International, trading at CA$212.43, is significantly undervalued based on discounted cash flows with an estimated value of CA$386.98. Despite high debt levels, its earnings are expected to grow 29.4% annually over three years, outpacing the Canadian market's growth rate of 10.9%. Although recent earnings showed a decline in net income and revenue compared to last year, the company maintains a strong position with no substantial insider selling recently reported.
- Our growth report here indicates TFI International may be poised for an improving outlook.
- Delve into the full analysis health report here for a deeper understanding of TFI International.
Where To Now?
- Take a closer look at our Undervalued TSX Stocks Based On Cash Flows list of 21 companies by clicking here.
- Are you invested in these stocks already? Keep abreast of every twist and turn by setting up a portfolio with Simply Wall St, where we make it simple for investors like you to stay informed and proactive.
- Simply Wall St is your key to unlocking global market trends, a free user-friendly app for forward-thinking investors.
Want To Explore Some Alternatives?
- Explore high-performing small cap companies that haven't yet garnered significant analyst attention.
- Diversify your portfolio with solid dividend payers offering reliable income streams to weather potential market turbulence.
- Fuel your portfolio with companies showing strong growth potential, backed by optimistic outlooks both from analysts and management.
This article by Simply Wall St is general in nature. We provide commentary based on historical data and analyst forecasts only using an unbiased methodology and our articles are not intended to be financial advice. It does not constitute a recommendation to buy or sell any stock, and does not take account of your objectives, or your financial situation. We aim to bring you long-term focused analysis driven by fundamental data. Note that our analysis may not factor in the latest price-sensitive company announcements or qualitative material. Simply Wall St has no position in any stocks mentioned.
Have feedback on this article? Concerned about the content? Get in touch with us directly. Alternatively, email editorial-team@simplywallst.com