


Three Days Left To Buy Artner Co., Ltd. (TSE:2163) Before The Ex-Dividend Date
Artner Co., Ltd. (TSE:2163) is about to trade ex-dividend in the next three days. The ex-dividend date is usually set to be two business days before the record date, which is the cut-off date on which you must be present on the company's books as a shareholder in order to receive the dividend. The ex-dividend date is of consequence because whenever a stock is bought or sold, the trade can take two business days or more to settle. Accordingly, Artner investors that purchase the stock on or after the 30th of July will not receive the dividend, which will be paid on the 7th of October.
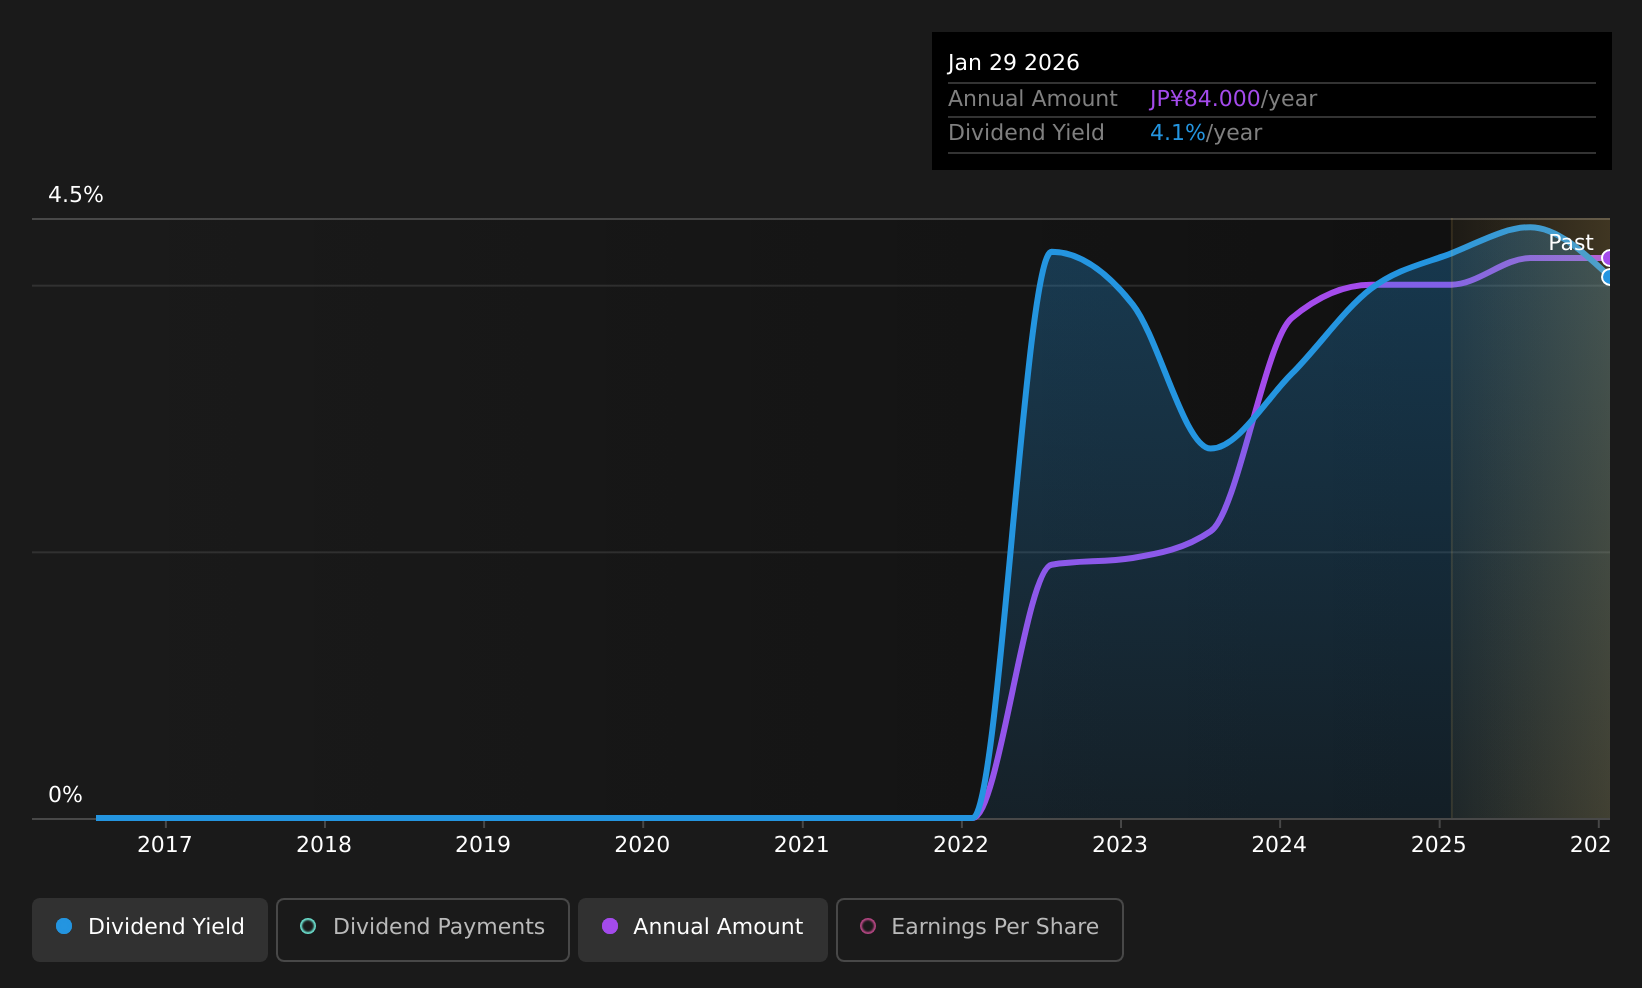
The company's next dividend payment will be JP¥43.00 per share, and in the last 12 months, the company paid a total of JP¥86.00 per share. Calculating the last year's worth of payments shows that Artner has a trailing yield of 4.3% on the current share price of JP¥1993.00. Dividends are an important source of income to many shareholders, but the health of the business is crucial to maintaining those dividends. As a result, readers should always check whether Artner has been able to grow its dividends, or if the dividend might be cut.
Dividends are usually paid out of company profits, so if a company pays out more than it earned then its dividend is usually at greater risk of being cut. Artner paid out 67% of its earnings to investors last year, a normal payout level for most businesses. Yet cash flows are even more important than profits for assessing a dividend, so we need to see if the company generated enough cash to pay its distribution. It paid out more than half (67%) of its free cash flow in the past year, which is within an average range for most companies.
It's encouraging to see that the dividend is covered by both profit and cash flow. This generally suggests the dividend is sustainable, as long as earnings don't drop precipitously.
View our latest analysis for Artner
Click here to see how much of its profit Artner paid out over the last 12 months.
Have Earnings And Dividends Been Growing?
Companies with consistently growing earnings per share generally make the best dividend stocks, as they usually find it easier to grow dividends per share. If earnings decline and the company is forced to cut its dividend, investors could watch the value of their investment go up in smoke. For this reason, we're glad to see Artner's earnings per share have risen 16% per annum over the last five years. Artner has an average payout ratio which suggests a balance between growing earnings and rewarding shareholders. This is a reasonable combination that could hint at some further dividend increases in the future.
The main way most investors will assess a company's dividend prospects is by checking the historical rate of dividend growth. Since the start of our data, four years ago, Artner has lifted its dividend by approximately 23% a year on average. It's great to see earnings per share growing rapidly over several years, and dividends per share growing right along with it.
To Sum It Up
Has Artner got what it takes to maintain its dividend payments? It's good to see earnings are growing, since all of the best dividend stocks grow their earnings meaningfully over the long run. That's why we're glad to see Artner's earnings per share growing, although as we saw, the company is paying out more than half of its earnings and cashflow - 67% and 67% respectively. Overall, it's not a bad combination, but we feel that there are likely more attractive dividend prospects out there.
Want to learn more about Artner? Here's a visualisation of its historical rate of revenue and earnings growth.
If you're in the market for strong dividend payers, we recommend checking our selection of top dividend stocks.
Have feedback on this article? Concerned about the content? Get in touch with us directly. Alternatively, email editorial-team (at) simplywallst.com.
This article by Simply Wall St is general in nature. We provide commentary based on historical data and analyst forecasts only using an unbiased methodology and our articles are not intended to be financial advice. It does not constitute a recommendation to buy or sell any stock, and does not take account of your objectives, or your financial situation. We aim to bring you long-term focused analysis driven by fundamental data. Note that our analysis may not factor in the latest price-sensitive company announcements or qualitative material. Simply Wall St has no position in any stocks mentioned.