


St. Joe (JOE) Stock Could Be A Bargain Despite Its 44% Run
St. Joe stock has delivered a 43.8% gain over the past five years, and the Discounted Cash Flow (DCF) intrinsic value estimate now points to the shares trading at a 49.2% discount, even as other valuation checks and market multiples suggest a more expensive picture.
- Over five years, St. Joe has returned 43.8%, which puts long term holders in positive territory and raises the question of how much upside may realistically be left from here.
- The current growth narrative around migration and land development in Northwest Florida can support optimistic cash flow expectations, but execution risk on large scale projects may influence how much of that potential ultimately reaches shareholders.
- On Simply Wall St's broader valuation checks, St. Joe scores 2 out of 6, which leans more toward expensive than a clear bargain despite what the intrinsic value estimate suggests.
The key question for investors is whether the current price should be viewed as an opportunity that aligns with the intrinsic value estimate or as a stock that already reflects much of St. Joe's long term story.
Is St. Joe Still Cheap on Cash Flow?
The Discounted Cash Flow (DCF) approach used here looks at the cash St. Joe can generate for shareholders and discounts it back to today. Based on the latest twelve month numbers, St. Joe is estimated to have produced about $196.8 million of free cash flow, and the model applies a growing cash flow profile over time, then tapers that growth in a second stage.
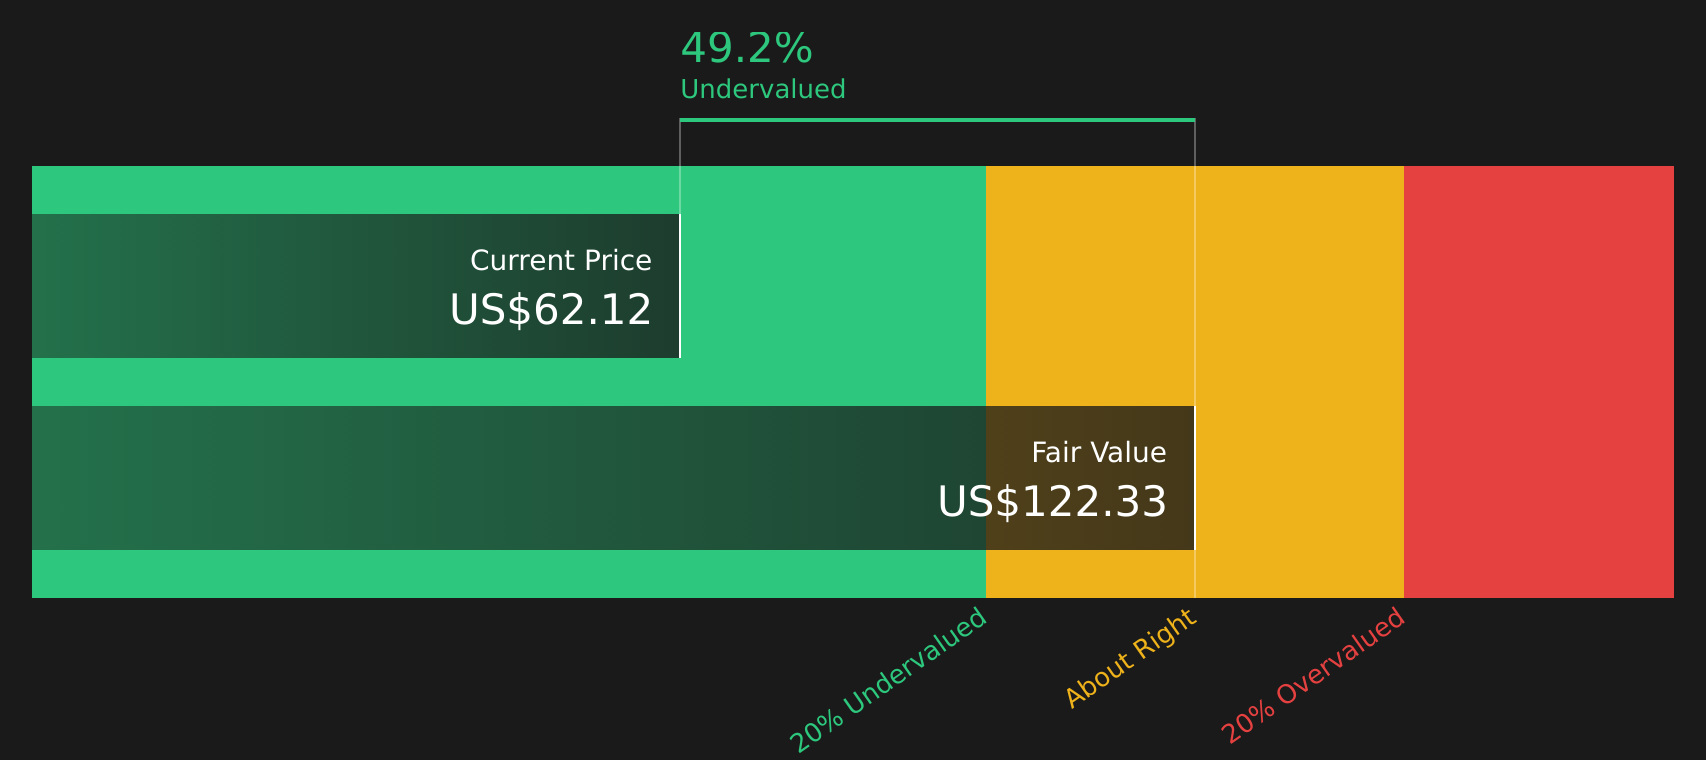
On this basis, the DCF points to an intrinsic value of about $122 per share. This is well above the current market price and implies the stock is 49.2% undervalued. Because the model relies on ongoing growth in free cash flow from projects across Northwest Florida, execution on development, hospitality and homesite sales remains central to whether these cash flow expectations are met. The new PulteGroup agreement for up to 2,653 homesites supports the long-term cash flow story, but the market is still pricing St. Joe below the level that this model suggests its cash generation could justify.
Overall, the Discounted Cash Flow view presents St. Joe stock as undervalued relative to the current share price.
Our Discounted Cash Flow (DCF) analysis suggests St. Joe is undervalued by 49.2%. Track this in your watchlist or portfolio, or discover 49 more high quality undervalued stocks.
Is St. Joe Getting Expensive on Earnings?
P/E is a useful lens for St. Joe because earnings are a key link between its land, hospitality and residential activities and what ultimately accrues to shareholders. St. Joe currently trades on a P/E of about 31.8x, which is well above both the Real Estate industry average of 19.6x and the peer group average of 13.0x.
This gap suggests investors are paying a premium price for each dollar of St. Joe’s earnings compared with many real estate peers. With the stock already on a materially higher multiple than the sector, the market appears willing to ascribe a richer valuation to the current earnings base, even before considering any future project execution.
On the P/E multiple alone, St. Joe stock appears overvalued relative to the broader Real Estate sector and peer group.

See what the numbers say about this price — find out in our valuation breakdown.
The St. Joe Narrative: What Would Justify Today's Price?
Simply Wall St Narratives pick up where this valuation puzzle for St. Joe leaves off by spelling out which combinations of future growth, margins and earnings would need to hold for the stock to be worth materially more or less than today's price, and they sit on the company's Community page. Each narrative links a specific fair value estimate to a clear set of potential catalysts and risks for St. Joe's business so you can track over time which story is coming through most strongly.
If you have a number driven view on whether St. Joe's Northwest Florida migration and land story, including the new PulteGroup homesite agreement, really supports the current price, be one of the first voices in the Simply Wall St community to set out a clear narrative and track how it holds up as new results come through.
Do you think there's more to the story for St. Joe? Head over to our Community to see what others are saying!
The Bottom Line
For St. Joe, the Discounted Cash Flow (DCF) intrinsic value estimate points to meaningful upside, while the earnings multiple signals the stock is already priced at a premium to peers. That gap reflects a market that is skeptical about how much of the projected cash flow from Northwest Florida projects will convert into sustainable earnings.
Broader valuation checks remain weak despite the supportive intrinsic value view. The key question is whether St. Joe can execute on its development and hospitality pipeline well enough for reported earnings to catch up with the growth implied by cash flow forecasts.
This article by Simply Wall St is general in nature. We provide commentary based on historical data and analyst forecasts only using an unbiased methodology and our articles are not intended to be financial advice. It does not constitute a recommendation to buy or sell any stock, and does not take account of your objectives, or your financial situation. We aim to bring you long-term focused analysis driven by fundamental data. Note that our analysis may not factor in the latest price-sensitive company announcements or qualitative material. Simply Wall St has no position in any stocks mentioned.
Have feedback on this article? Concerned about the content? Get in touch with us directly. Alternatively, email editorial-team@simplywallst.com