


Q2 Holdings (QTWO) Stock Looks Undervalued Next To Its Fair Value
Q2 Holdings stock sits at an interesting valuation crossroads, with an intrinsic value estimate from a Discounted Cash Flow (DCF) model pointing to meaningful upside, while traditional market multiples suggest the shares are already pricing in a lot of optimism.
- Q2 Holdings has returned 56.3% over the past 3 years, which puts more focus on whether the current share price still leaves room for further value.
- Recent news around stronger profitability and record bookings can support expectations for higher future cash flows, but analyst commentary and a reduced price target underline the risk that growth or free cash flow expansion may fall short of what the current price implies.
- The company scores 4 out of 6 on valuation checks. This mixed picture suggests Q2 Holdings is neither a clear bargain nor clearly expensive when looking across multiple methods, including valuation score details.
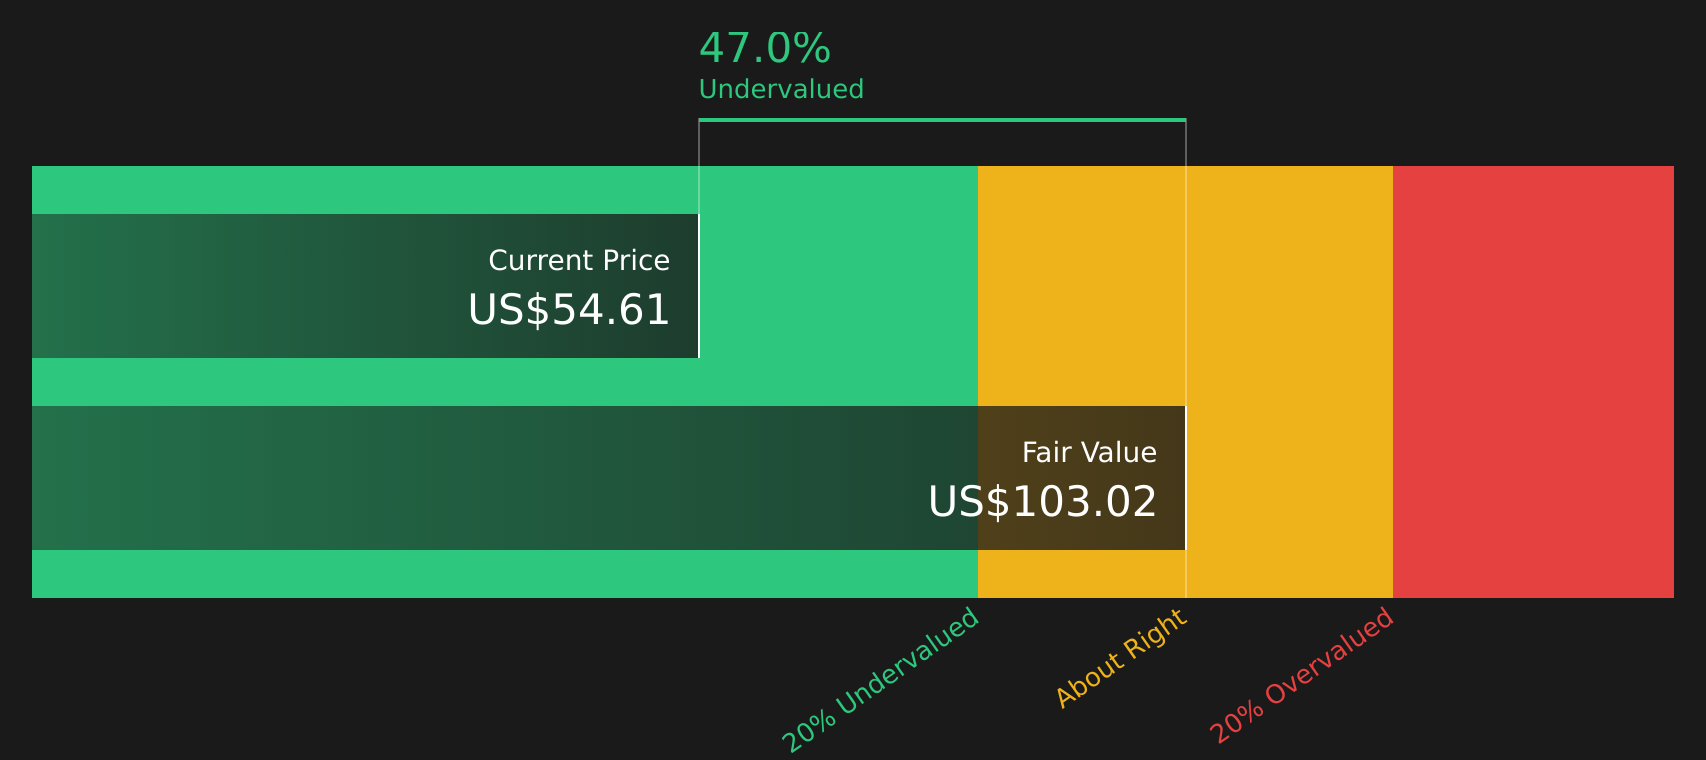
The issue now is whether the roughly 46.7% discount implied by the DCF intrinsic value estimate is a genuine margin of safety for Q2 Holdings or simply reflects more cautious expectations already embedded in the share price.
Find out why Q2 Holdings' -38.8% return over the last year is lagging behind its peers.
Is Q2 Holdings a Bargain on Cash Flow?
The Discounted Cash Flow (DCF) model estimates the value of Q2 Holdings by projecting its potential future free cash flows and discounting them back to today.
For Q2 Holdings, the model uses latest twelve month free cash flow of about $179.3 million and assumes that cash flows continue growing over time rather than shrinking. On that basis, the 2 Stage Free Cash Flow to Equity approach points to an estimated intrinsic value of about $102.51 per share, compared with a market price that implies a roughly 46.7% discount to that figure.
Because Q2 Holdings recently reported stronger profitability, record bookings and higher 2026 guidance, the gap between the DCF estimate and the share price can be interpreted as the market remaining cautious about how much of that guidance will ultimately show up in free cash flow.
Overall, the DCF analysis indicates that Q2 Holdings stock currently appears undervalued relative to its modeled cash flow potential.
Our Discounted Cash Flow (DCF) analysis suggests Q2 Holdings is undervalued by 46.7%. Track this in your watchlist or portfolio, or discover 49 more high quality undervalued stocks.
Has Q2 Holdings Run Too Far on Earnings?
P/E is a useful lens for Q2 Holdings because the company is now earning positive profits that can be compared directly with its share price. Q2 Holdings currently trades on a P/E of about 46.3x, which is higher than the broader software industry average of roughly 27.8x and below the peer group average of about 55.7x.
The fair P/E ratio for Q2 Holdings, based on its characteristics, is estimated at around 31.9x, which is materially lower than where the stock trades today. That gap suggests investors are already paying a premium for Q2 Holdings relative to what this framework indicates would be reasonable, even before considering other risks or execution questions.
On this P/E yardstick, Q2 Holdings stock screens as overvalued compared with the level implied by its fair multiple.

See what the numbers say about this price — find out in our valuation breakdown.
The Q2 Holdings Narrative: What Would Justify Today's Price?
Simply Wall St Narratives for Q2 Holdings sit between the DCF upside and the richer P/E multiple by explaining what paths for Q2 Holdings' growth, margins and earnings would need to hold for the stock to be worth materially more or less than today. They are hosted on Simply Wall St's Community page. Each one presents a fair value view as a thesis about Q2 Holdings' business that can be tracked over time rather than treated as a one off snapshot.
If you have a clear, number driven view on whether Q2 Holdings' record bookings, stronger profitability and higher 2026 guidance will translate into the cash flows the market is expecting, share a Narrative in the Simply Wall St community and spell out your case.
This is a chance to add your voice, set out the key assumptions behind your outlook for Q2 Holdings' growth and margins, and see how your thesis stacks up as new results and guidance arrive.
Do you think there's more to the story for Q2 Holdings? Head over to our Community to see what others are saying!
The Bottom Line
Q2 Holdings sits between an intrinsic value view that screens the stock as undervalued on Discounted Cash Flow (DCF) and a market multiple view that points to an overvalued P/E. That gap reflects different priorities, with the DCF leaning on long term cash flow delivery, while the P/E captures what investors are already paying for growth and sentiment today. With broader checks giving a mixed read rather than a clear green light, the key question is whether Q2 Holdings can translate its recent profitability and bookings into durable free cash flow that supports both its intrinsic value estimate and its premium multiple.
This article by Simply Wall St is general in nature. We provide commentary based on historical data and analyst forecasts only using an unbiased methodology and our articles are not intended to be financial advice. It does not constitute a recommendation to buy or sell any stock, and does not take account of your objectives, or your financial situation. We aim to bring you long-term focused analysis driven by fundamental data. Note that our analysis may not factor in the latest price-sensitive company announcements or qualitative material. Simply Wall St has no position in any stocks mentioned.
Have feedback on this article? Concerned about the content? Get in touch with us directly. Alternatively, email editorial-team@simplywallst.com