


Asian Stocks Trading Below Estimated Value In July 2026
In July 2026, the Asian markets have been experiencing heightened volatility, largely influenced by global economic shifts and geopolitical tensions. Amidst these fluctuations, identifying stocks trading below their estimated value can offer potential opportunities for investors looking to capitalize on market inefficiencies.
Top 10 Undervalued Stocks Based On Cash Flows In Asia
| Name | Current Price | Fair Value (Est) | Discount (Est) |
| SHIFT (TSE:3697) | ¥745.80 | ¥1491.41 | 50% |
| Seojin SystemLtd (KOSDAQ:A178320) | ₩42500.00 | ₩84641.78 | 49.8% |
| Samyang Foods (KOSE:A003230) | ₩1127000.00 | ₩2214803.55 | 49.1% |
| Rakuten Bank (TSE:5838) | ¥5714.00 | ¥11167.01 | 48.8% |
| Pan-United (SGX:P52) | SGD1.62 | SGD3.16 | 48.7% |
| NC Chem (KOSDAQ:A482630) | ₩13170.00 | ₩25761.68 | 48.9% |
| Moshi Moshi Retail Corporation (SET:MOSHI) | THB39.25 | THB76.63 | 48.8% |
| Matrix Design (SZSE:301365) | CN¥36.80 | CN¥73.26 | 49.8% |
| Loncin Motor (SHSE:603766) | CN¥13.77 | CN¥27.01 | 49% |
| Info-Tech Systems (SGX:ITS) | SGD0.98 | SGD1.94 | 49.5% |
We're going to check out a few of the best picks from our screener tool.
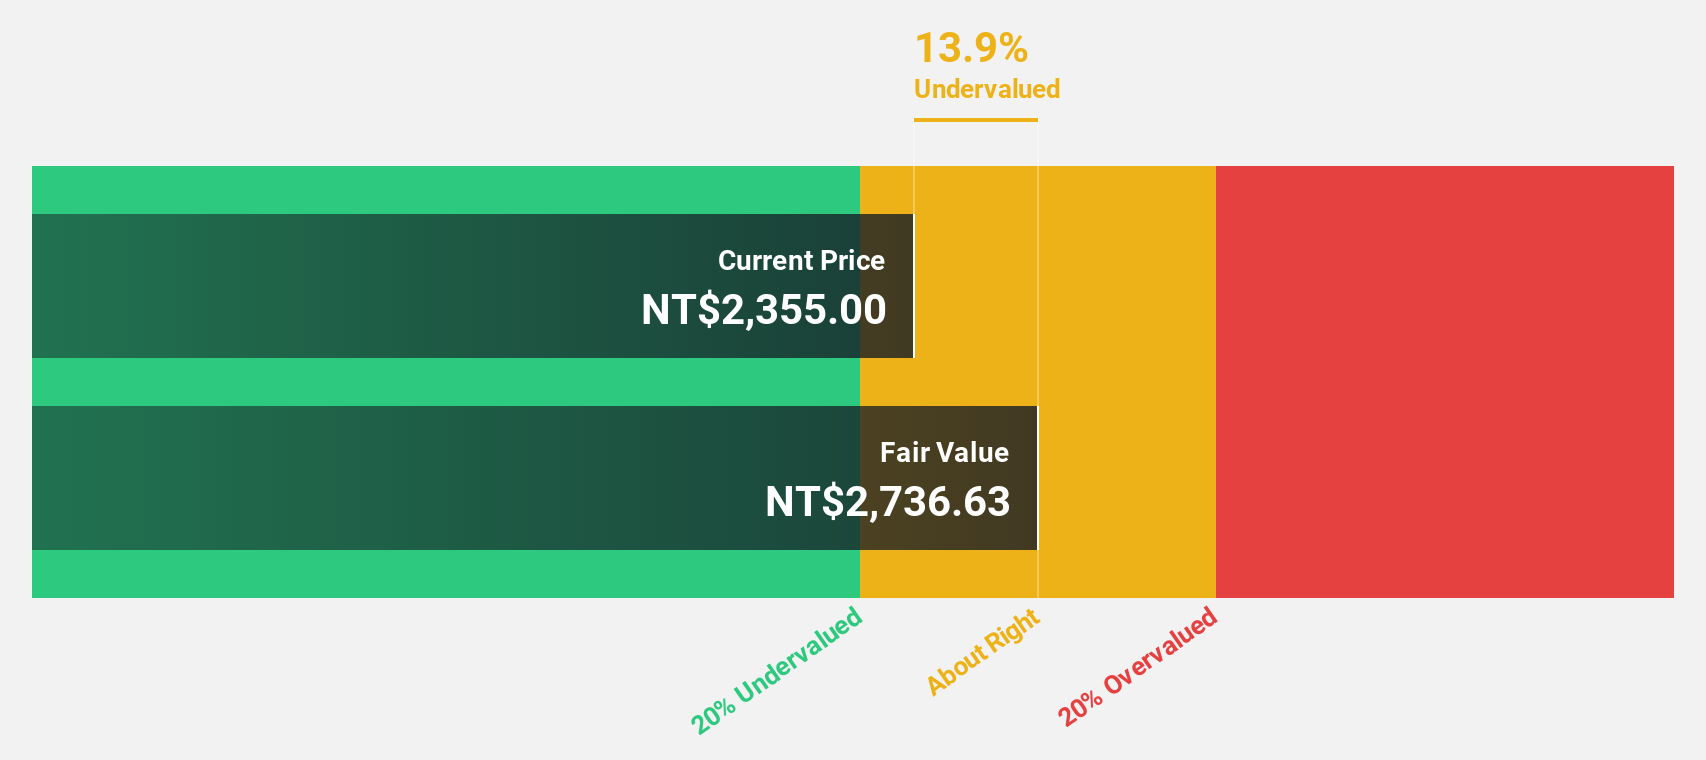
Chunghwa Precision Test Tech (TPEX:6510)
Overview: Chunghwa Precision Test Tech. Co., Ltd. and its subsidiaries specialize in testing semiconductor components both in Taiwan and internationally, with a market cap of NT$90.50 billion.
Operations: The company generates revenue from its Electronic Components & Parts segment, amounting to NT$5.01 billion.
Estimated Discount To Fair Value: 20.6%
Chunghwa Precision Test Tech appears undervalued, trading 20.6% below its fair value estimate of NT$3,476.89 based on discounted cash flows. Its revenue and earnings are forecast to grow significantly faster than the Taiwan market, with earnings expected to increase by 61.63% annually. Despite recent share price volatility, analysts agree on a potential price rise of 63.1%. Recent earnings showed strong growth in sales and net income compared to last year’s figures.
- Our expertly prepared growth report on Chunghwa Precision Test Tech implies its future financial outlook may be stronger than recent results.
- Navigate through the intricacies of Chunghwa Precision Test Tech with our comprehensive financial health report here.
MEC (TSE:4971)
Overview: MEC Company Ltd. focuses on the research, development, production, and sale of chemicals and equipment for printed circuit boards across several regions including Japan and Europe, with a market cap of ¥163.80 billion.
Operations: The company's revenue segments include ¥17.50 billion from chemicals, ¥5.20 billion from equipment, and ¥3.80 billion from related materials for printed circuit boards across Japan, Taiwan, Hong Kong, China, Thailand, and Europe.
Estimated Discount To Fair Value: 17.1%
MEC is trading at ¥8,970, below its estimated fair value of ¥10,826.64 based on discounted cash flows. Revenue growth is expected to outpace the Japanese market at 13.4% annually, with earnings forecast to grow 11.31% per year. Recent guidance revisions reflect strong demand in semiconductor substrates for AI and data centers, leading to increased sales and operating income forecasts for 2026 despite geopolitical uncertainties affecting future projections.
- Our earnings growth report unveils the potential for significant increases in MEC's future results.
- Delve into the full analysis health report here for a deeper understanding of MEC.

ITEQ (TWSE:6213)
Overview: ITEQ Corporation manufactures and sells copper clad laminate materials for printed circuit board fabrication across Taiwan, Asia, Europe, and internationally, with a market cap of NT$124.83 billion.
Operations: The company's revenue segments in millions of NT$ are Wuxi Lianmao at 14.20 billion, Jiangxi Lianmao at 20.05 billion, Dongguan Lianmao at 5.14 billion, and ITEQ Corporation itself at 2.68 billion.
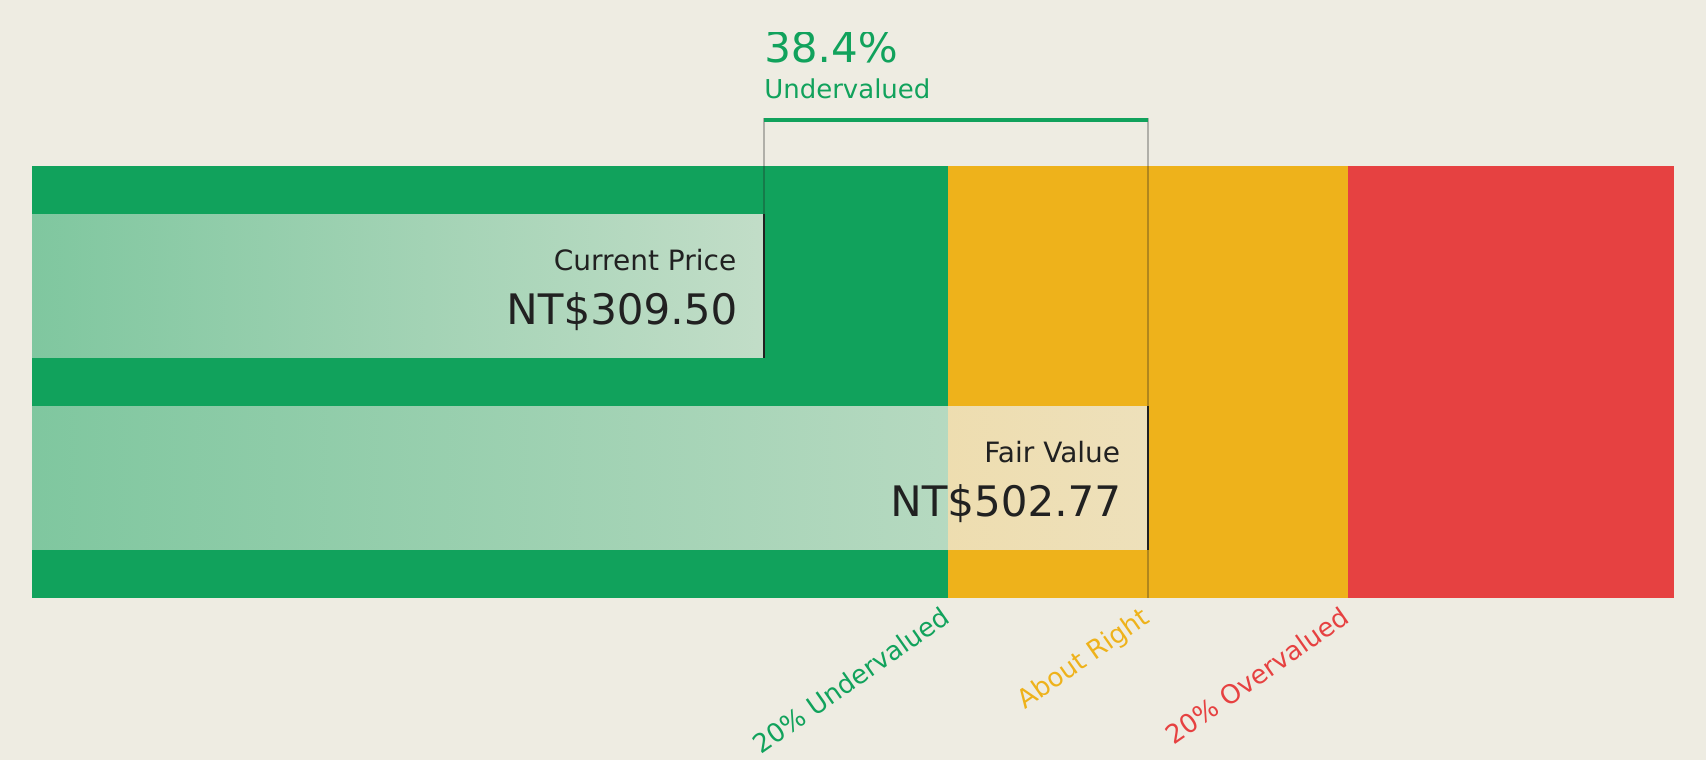
Estimated Discount To Fair Value: 31.4%
ITEQ is trading at NT$343.5, significantly below its estimated future cash flow value of NT$500.93, indicating it may be undervalued. Despite a volatile share price recently, earnings are projected to grow 39.8% annually over the next three years, outpacing Taiwan's market growth rate of 25.8%. However, return on equity is expected to remain modest at 19.1%. Recent quarterly sales increased to TWD 9.14 billion from TWD 7.58 billion year-on-year.
- The growth report we've compiled suggests that ITEQ's future prospects could be on the up.
- Dive into the specifics of ITEQ here with our thorough financial health report.
Turning Ideas Into Actions
- Delve into our full catalog of 209 Undervalued Asian Stocks Based On Cash Flows here.
- Hold shares in these firms? Setup your portfolio in Simply Wall St to seamlessly track your investments and receive personalized updates on your portfolio's performance.
- Invest smarter with the free Simply Wall St app providing detailed insights into every stock market around the globe.
Looking For Alternative Opportunities?
- Explore high-performing small cap companies that haven't yet garnered significant analyst attention.
- Diversify your portfolio with solid dividend payers offering reliable income streams to weather potential market turbulence.
- Fuel your portfolio with companies showing strong growth potential, backed by optimistic outlooks both from analysts and management.
This article by Simply Wall St is general in nature. We provide commentary based on historical data and analyst forecasts only using an unbiased methodology and our articles are not intended to be financial advice. It does not constitute a recommendation to buy or sell any stock, and does not take account of your objectives, or your financial situation. We aim to bring you long-term focused analysis driven by fundamental data. Note that our analysis may not factor in the latest price-sensitive company announcements or qualitative material. Simply Wall St has no position in any stocks mentioned.
Have feedback on this article? Concerned about the content? Get in touch with us directly. Alternatively, email editorial-team@simplywallst.com