


3 European Dividend Stocks To Consider For Your Portfolio
The European market has recently experienced a mixed performance, with the pan-European STOXX Europe 600 Index ending a volatile week largely unchanged despite global tech stock weaknesses and rising oil prices. Amid these fluctuations, dividend stocks in Europe continue to attract attention as they offer potential stability and income generation in uncertain times. Evaluating dividend stocks involves considering factors such as consistent payout history, financial health, and resilience to economic shifts—qualities that can be particularly appealing given the current market dynamics.
Top 10 Dividend Stocks In Europe
| Name | Dividend Yield | Dividend Rating |
| Zurich Insurance Group (SWX:ZURN) | 4.01% | ★★★★★★ |
| Teleperformance (ENXTPA:TEP) | 8.20% | ★★★★★★ |
| Telekom Austria (WBAG:TKA) | 4.17% | ★★★★★★ |
| Swiss Re (SWX:SREN) | 4.67% | ★★★★★★ |
| Rubis (ENXTPA:RUI) | 6.41% | ★★★★★★ |
| Logista Integral (BME:LOG) | 5.83% | ★★★★★★ |
| Hannover Rück (XTRA:HNR1) | 4.90% | ★★★★★★ |
| Edel SE KGaA (XTRA:EDL) | 6.20% | ★★★★★★ |
| d'Amico International Shipping (BIT:DIS) | 4.86% | ★★★★★☆ |
| Cembra Money Bank (SWX:CMBN) | 4.71% | ★★★★★★ |
Click here to see the full list of 206 stocks from our Top European Dividend Stocks screener.
Here we highlight a subset of our preferred stocks from the screener.
IAR (BVB:IARV)
Simply Wall St Dividend Rating: ★★★★★☆
Overview: IAR S.A. is a Romanian company that develops, manufactures, and sells aeronautical products, with a market cap of RON599.55 million.
Operations: IAR S.A.'s revenue is primarily derived from its Aerospace & Defense segment, which generated RON429.57 million.
Dividend Yield: 7.2%
IAR S.A. has announced an annual dividend of RON 1.342 per share, reflecting a commitment to shareholder returns despite a volatile dividend history over the past decade. While dividends are covered by earnings and cash flows with payout ratios of 68.4% and 70.8%, respectively, their reliability remains questionable due to past volatility exceeding 20%. Recent earnings growth of RON 30.65 million in Q1, up from RON 15.5 million last year, supports current payouts amidst fluctuating sales figures.
- Click here and access our complete dividend analysis report to understand the dynamics of IAR.
- Insights from our recent valuation report point to the potential undervaluation of IAR shares in the market.

Kemira Oyj (HLSE:KEMIRA)
Simply Wall St Dividend Rating: ★★★★★☆
Overview: Kemira Oyj is a chemicals company based in Finland with operations across Europe, the Middle East, Africa, the Americas, and the Asia Pacific, and it has a market cap of approximately €2.47 billion.
Operations: Kemira Oyj generates its revenue from three main segments: Water Solutions (€1.24 billion), Fiber Essentials (€536.50 million), and Packaging & Hygiene Solutions (€949.10 million).
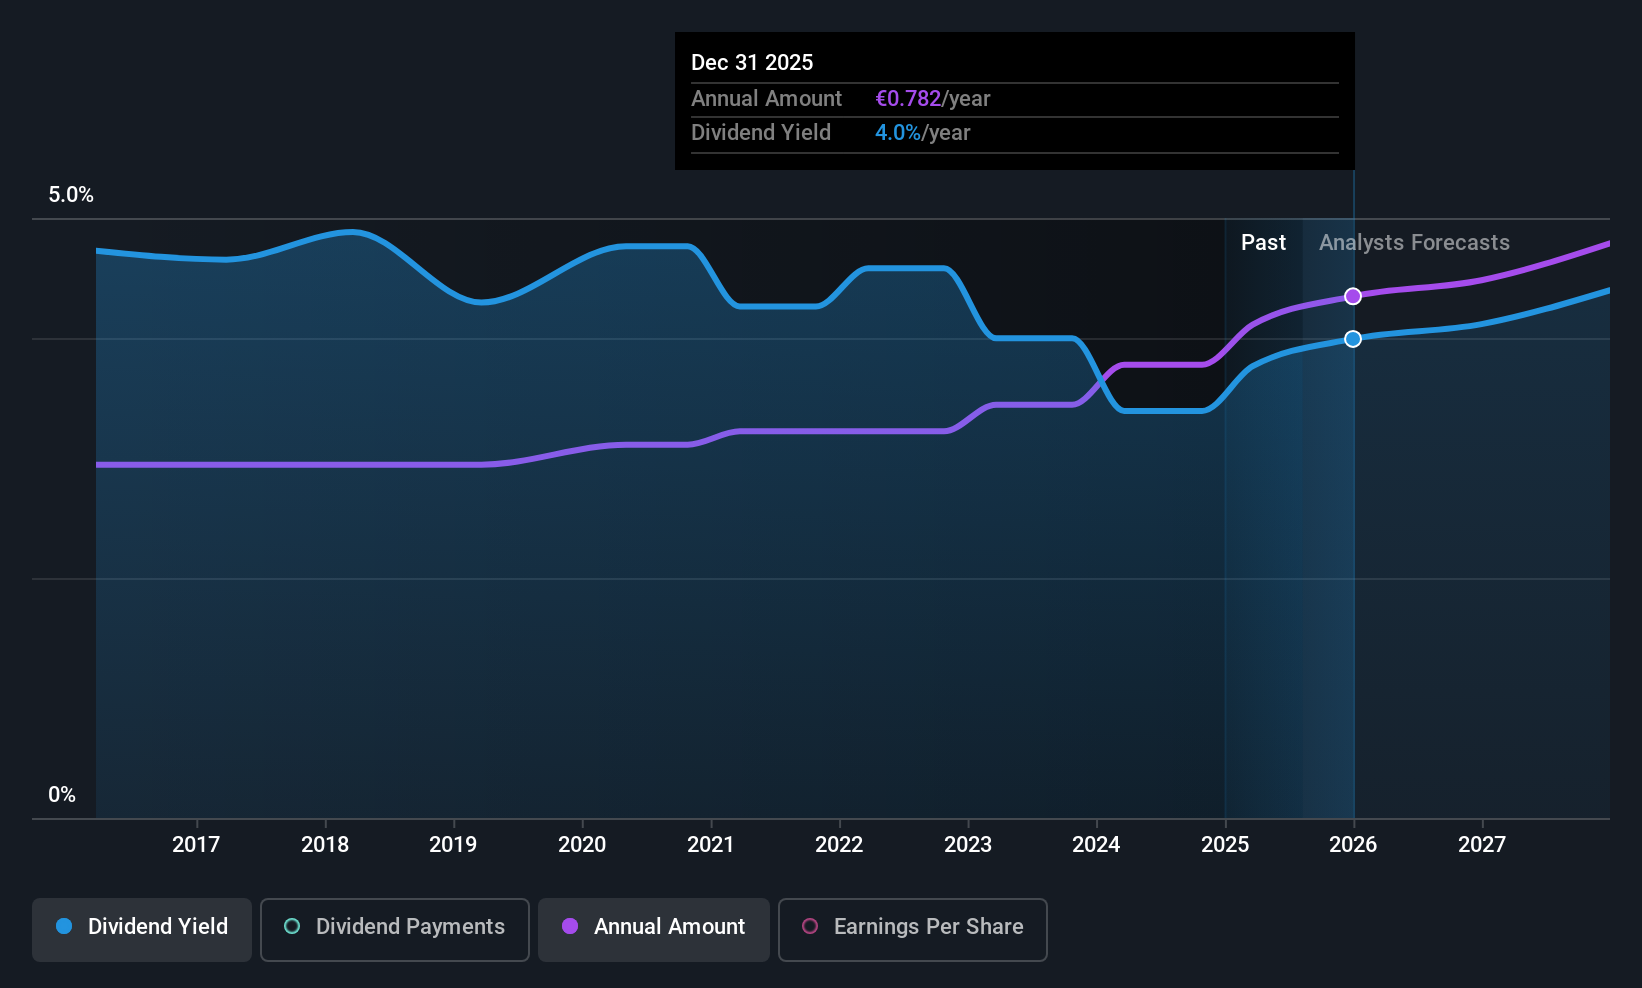
Dividend Yield: 4.5%
Kemira Oyj offers a stable and reliable dividend, with payments increasing over the past decade. Despite a dividend yield of 4.46%, which trails the Finnish market's top payers, its dividends are well-covered by earnings (78.4% payout ratio) and cash flows (53%). Recent financial results show a decline in net income due to increased costs from geopolitical tensions, yet the company maintains its revenue guidance for 2026 at €2.6-3 billion.
- Get an in-depth perspective on Kemira Oyj's performance by reading our dividend report here.
- Upon reviewing our latest valuation report, Kemira Oyj's share price might be too pessimistic.
Softronic (OM:SOF B)
Simply Wall St Dividend Rating: ★★★★☆☆
Overview: Softronic AB (publ) and its subsidiaries offer information technology and management consulting services in Sweden, with a market cap of SEK1.20 billion.
Operations: Softronic AB (publ) generates revenue from providing information technology and management consulting services in Sweden.
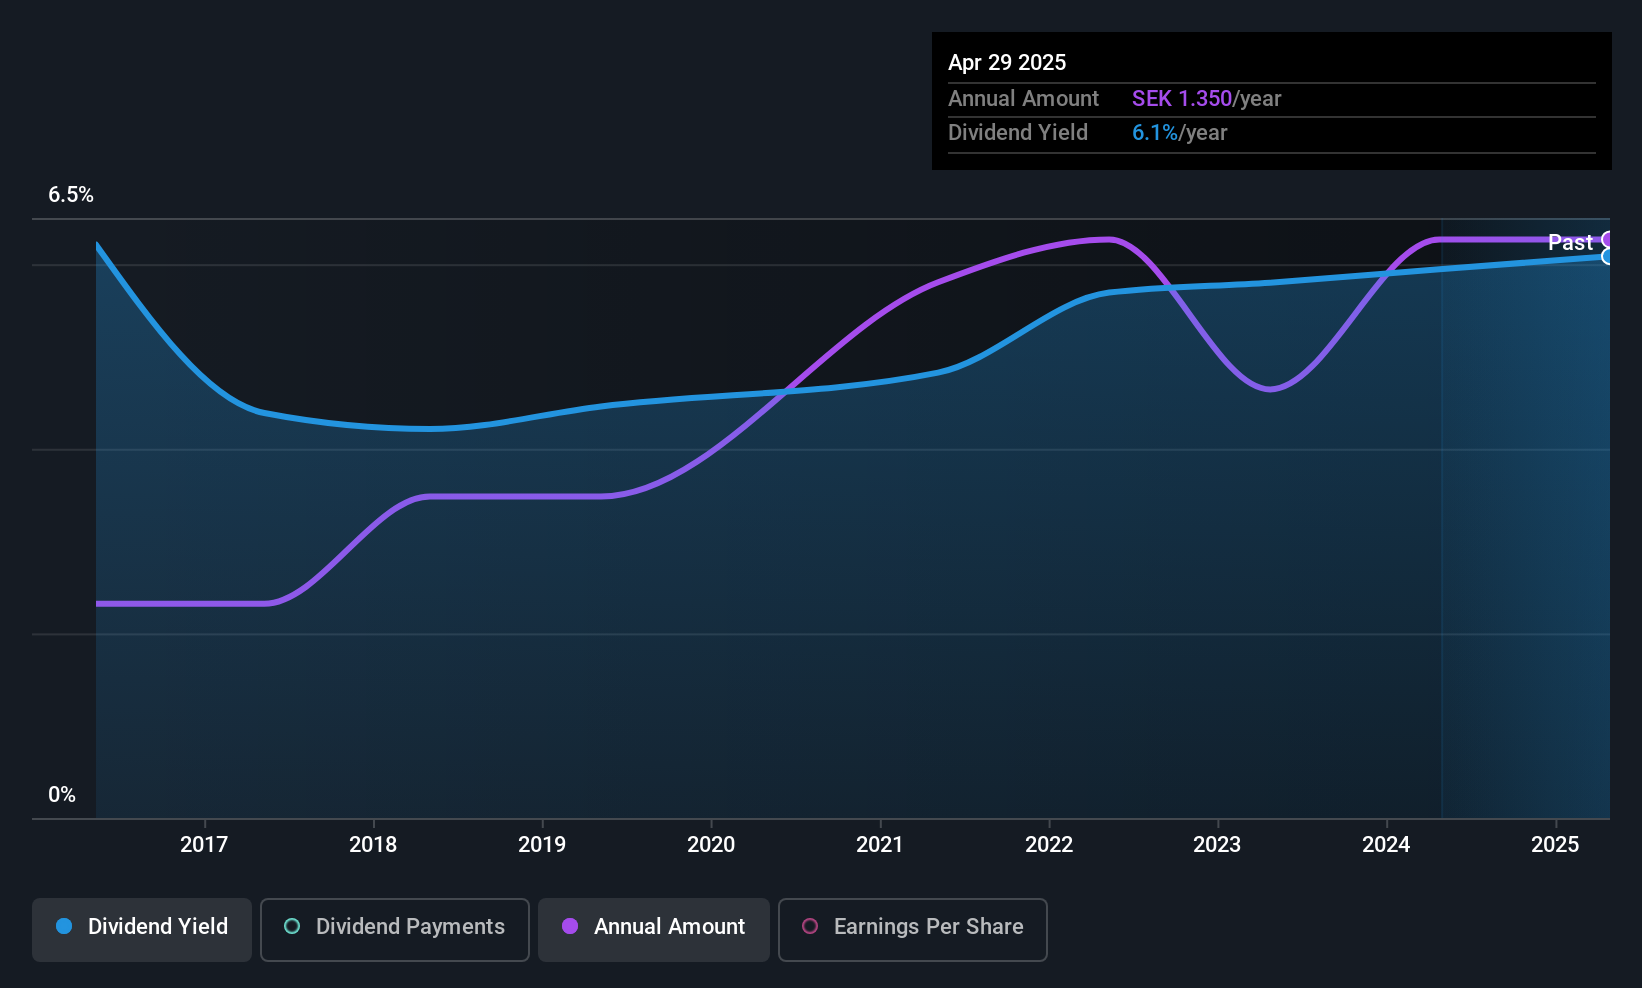
Dividend Yield: 5.9%
Softronic's recent earnings reveal improved financial performance, with second-quarter sales rising to SEK 256.1 million and net income increasing to SEK 20.2 million. Despite trading below its estimated fair value, Softronic's dividend yield of 5.93% ranks it among the top Swedish payers but is not well covered by earnings due to a high payout ratio of 95.3%. The dividends have grown over the past decade but remain volatile and unreliable, with coverage primarily reliant on cash flows rather than consistent earnings stability.
- Dive into the specifics of Softronic here with our thorough dividend report.
- In light of our recent valuation report, it seems possible that Softronic is trading behind its estimated value.
Next Steps
- Access the full spectrum of 206 Top European Dividend Stocks by clicking on this link.
- Are these companies part of your investment strategy? Use Simply Wall St to consolidate your holdings into a portfolio and gain insights with our comprehensive analysis tools.
- Simply Wall St is your key to unlocking global market trends, a free user-friendly app for forward-thinking investors.
Curious About Other Options?
- Explore high-performing small cap companies that haven't yet garnered significant analyst attention.
- Fuel your portfolio with companies showing strong growth potential, backed by optimistic outlooks both from analysts and management.
- Find companies with promising cash flow potential yet trading below their fair value.
This article by Simply Wall St is general in nature. We provide commentary based on historical data and analyst forecasts only using an unbiased methodology and our articles are not intended to be financial advice. It does not constitute a recommendation to buy or sell any stock, and does not take account of your objectives, or your financial situation. We aim to bring you long-term focused analysis driven by fundamental data. Note that our analysis may not factor in the latest price-sensitive company announcements or qualitative material. Simply Wall St has no position in any stocks mentioned.
Have feedback on this article? Concerned about the content? Get in touch with us directly. Alternatively, email editorial-team@simplywallst.com