


Is Takeuchi Mfg (TSE:6432) Undervalued On Rising Sales And Flat Quarterly Profit?
Sales Growth and Steady Profits in Takeuchi Mfg’s Latest Quarter
Takeuchi Mfg (TSE:6432) reported first quarter earnings to May 31, 2026, with sales of ¥56,809 million versus ¥50,620 million a year earlier, while net income and earnings per share were broadly unchanged.
See our latest analysis for Takeuchi Mfg.
Takeuchi Mfg’s share price is ¥7,140, with the stock down 2.86% on the day and 3.38% over the past month, but showing a 7.69% 90 day share price return and a 1 year total shareholder return of 52.64%, which indicates momentum that has cooled recently following a strong run.
If you are looking beyond Takeuchi Mfg in the machinery and equipment space, this could be a moment to review other robotics and automation opportunities using the 32 robotics and automation stocks.
After a strong 1 year run but a softer recent stretch, Takeuchi Mfg now sits at a share price that appears materially below some intrinsic estimates and slightly above the latest analyst target. Does the current balance still favour buyers or caution?
Preferred P/E of 11.7x: Is It Justified for Takeuchi Mfg?
On current data, Takeuchi Mfg’s valuation picture is mixed, with the stock trading at a P/E of 11.7x that screens slightly expensive versus its immediate peer group, but cheaper than the wider Japanese machinery sector and below an estimated fair P/E level.
The P/E ratio compares the company’s share price to its earnings per share and is a common way to see how much investors are paying for each unit of profit. For a business like Takeuchi Mfg that manufactures construction machinery and reports established earnings, P/E can be a useful shorthand for how the market is weighing its profit profile and growth outlook.
According to the data, Takeuchi Mfg is described as expensive relative to its direct peers, where the peer average P/E is 11.1x, suggesting the stock carries a modest premium in that narrower group. At the same time, it is described as good value versus the broader JP Machinery industry, where the average P/E stands at 14.5x, and also against an estimated fair P/E of 16.6x that the market could potentially move toward if sentiment and fundamentals remain aligned with that assessment. Result: Price-to-Earnings of 11.7x (ABOUT RIGHT)
Explore the SWS fair ratio for Takeuchi Mfg
However, investors in Takeuchi Mfg still need to watch for any earnings pressure relative to its 11.7x P/E, as well as shifts in demand across key regions like Japan and the US.
Find out about the key risks to this Takeuchi Mfg narrative.
Another View: What the SWS DCF Model Says About Takeuchi Mfg
While the P/E of 11.7x presents Takeuchi Mfg as roughly fairly priced against peers and the wider machinery sector, the SWS DCF model points to something different. In this view, the stock at ¥7,140 trades about 40.6% below an estimated fair value of ¥12,011.16. This suggests a wide gap that investors need to weigh carefully.
Look into how the SWS DCF model arrives at its fair value.
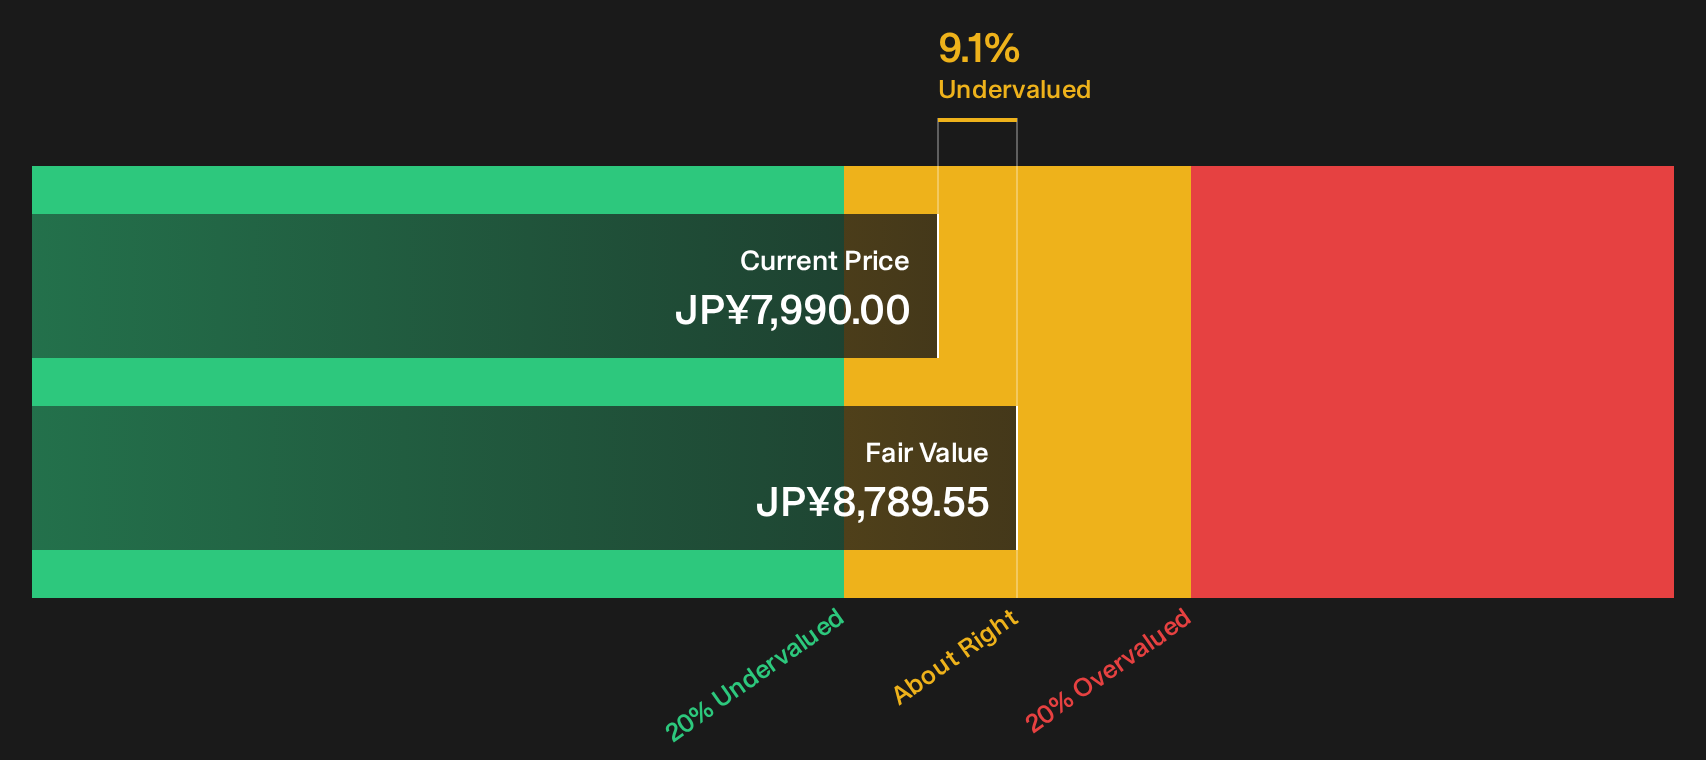
Simply Wall St performs a discounted cash flow (DCF) on every stock in the world every day (check out Takeuchi Mfg for example). We show the entire calculation in full. You can track the result in your watchlist or portfolio and be alerted when this changes, or use our stock screener to discover 18 high quality undervalued stocks. If you save a screener we even alert you when new companies match - so you never miss a potential opportunity.
Next Steps
Given the mix of signals around Takeuchi Mfg, this is a good moment to review the underlying drivers for yourself and decide how the risk reward tradeoff stacks up in your view. You can start with the 4 key rewards.
Looking for More Investment Ideas Beyond Takeuchi Mfg?
If Takeuchi Mfg has your attention, consider building a fuller watchlist by lining up a few different types of stocks that could suit your style and risk comfort.
- Spot potential mispricings early and compare valuation opportunities against Takeuchi Mfg using the 18 high quality undervalued stocks.
- Strengthen your income stream by reviewing companies with higher yields and more established payouts through the 47 dividend fortresses.
- Prioritize stability and financial resilience by scanning for companies with strong balance sheets via the solid balance sheet and fundamentals stocks screener (37 results).
This article by Simply Wall St is general in nature. We provide commentary based on historical data and analyst forecasts only using an unbiased methodology and our articles are not intended to be financial advice. It does not constitute a recommendation to buy or sell any stock, and does not take account of your objectives, or your financial situation. We aim to bring you long-term focused analysis driven by fundamental data. Note that our analysis may not factor in the latest price-sensitive company announcements or qualitative material. Simply Wall St has no position in any stocks mentioned.
Have feedback on this article? Concerned about the content? Get in touch with us directly. Alternatively, email editorial-team@simplywallst.com