


Rocket Companies (RKT) Stock Looks Cheap On Sales Yet Fair On Value
Rocket Companies stock has delivered a 43.4% return over the past 3 years, yet the current checks present a mixed valuation picture where the Excess Returns intrinsic value estimate points to a roughly fair price while the market multiples suggest the shares may still be on the cheap side.
- Over 3 years, Rocket Companies has returned 43.4%, which puts recent share performance firmly in positive territory for longer term holders.
- The scale of Rocket’s $2.1b servicing portfolio, along with integration progress after the Mr. Cooper acquisition, can support investor expectations for value creation. At the same time, regulatory scrutiny around partnerships such as the Redfin and Zillow apartment listings may weigh on how much investors are willing to pay for the stock.
- With only 2 of 6 valuation checks screening as attractive, Rocket Companies does not screen as a clear bargain on the broader set of valuation measures.
The issue now is whether the current price for Rocket Companies already reflects its homeownership platform ambitions, or if the combination of intrinsic value and multiples still leaves room for further upside.
Where Does Rocket Companies Sit on Excess Returns?
The Excess Returns model looks at how efficiently Rocket Companies turns its equity base into earnings above its implied cost of capital. On this view, Rocket Companies is assumed to earn a stable EPS of $1.03 per share on a stable book value of $9.49 per share, compared with a current book value of $8.22 per share.
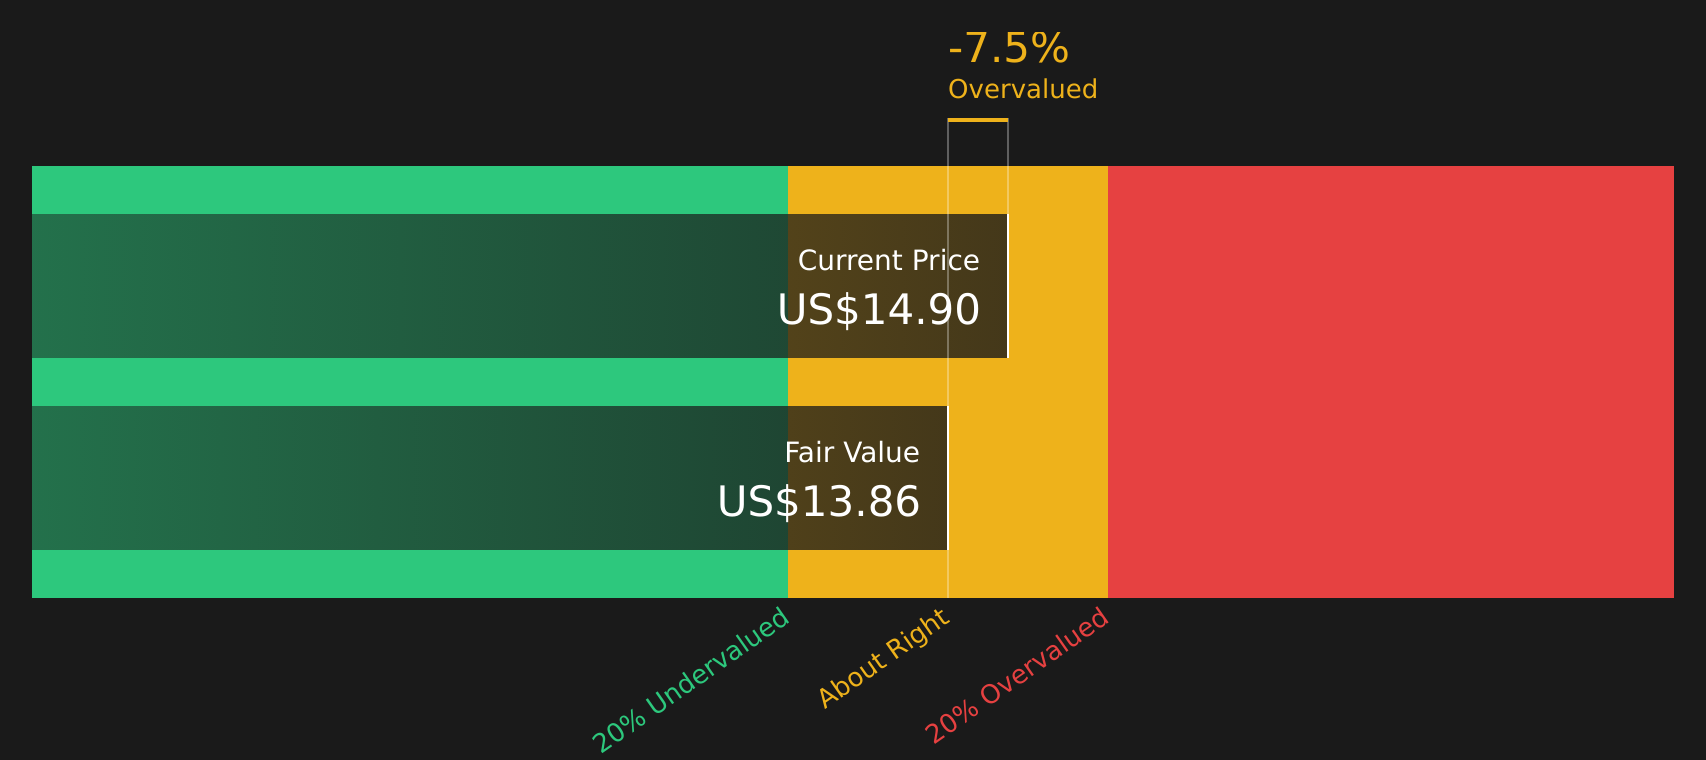
With an average forecast return on equity of 10.86% and an estimated cost of equity of $0.81 per share, the model calculates excess return of $0.22 per share. That stream of excess returns translates into an intrinsic value estimate of about $13.97 per share, a level that sits roughly 4.5% below the current share price. On this measure, Rocket Companies screens as slightly overvalued. The FTC trial over the Redfin and Zillow apartment listing partnership helps explain why some investors may be cautious even where the business model aims to build a broader homeownership platform.
On the Excess Returns view, Rocket Companies stock comes out as about fairly valued, sitting only modestly above its estimated intrinsic value.
Rocket Companies is fairly valued according to our Excess Returns, but this can change at a moment's notice. Track the value in your watchlist or portfolio and be alerted on when to act.
Is Rocket Companies Still Cheap on Sales?
P/S is a useful way to look at Rocket Companies because revenue can be volatile relative to earnings for mortgage and housing platform businesses. Rocket Companies currently trades on a P/S of 4.6x, which is above the diversified financial industry average of 2.3x and also above the peer group average of 2.0x.
However, the tailored fair P/S ratio for Rocket Companies is 5.6x, which reflects the company’s specific mix of growth prospects, margins, scale and risk. Compared with that benchmark, the current 4.6x multiple implies the stock trades at a discount to what the model suggests could be reasonable for Rocket Companies based on these characteristics.
On the P/S lens, Rocket Companies stock appears undervalued relative to its company specific fair multiple.

See what the numbers say about this price — find out in our valuation breakdown.
The Rocket Companies Narrative: What Would Justify Today's Price?
For Rocket Companies, Simply Wall St Narratives pick up where the valuation puzzle leaves off by spelling out what kind of future growth, margins and earnings would need to occur for the stock to be worth significantly more or less than today’s price, and they sit on the company’s Community page. Rather than relying on a single multiple or model output, each Narrative lays out the assumptions behind its fair value view so you can compare them with Rocket Companies' actual results over time.
One of the top community narratives on Rocket Companies: 27% undervalued
"Rocket's heavy investments in proprietary AI and automation are demonstrably lowering origination and operating costs, increasing capacity and productivity, and creating durable improvements in operational leverage..."
Read one of the top narratives on Rocket Companies
Do you think there's more to the story for Rocket Companies? Head over to our Community to see what others are saying!
The Bottom Line
For Rocket Companies, the Excess Returns intrinsic value estimate points to a stock that is roughly in line with its calculated worth, while the P/S work suggests the shares trade on an undemanding multiple. That split reflects different emphases; intrinsic value is more sensitive to funding needs and the durability of excess returns, while the sales multiple leans on how much growth and margin strength investors expect the platform to support. With broader valuation checks screening as weak overall, the key question is whether the apparent discount on sales compensates for regulatory and execution risks or simply reflects them accurately.
This article by Simply Wall St is general in nature. We provide commentary based on historical data and analyst forecasts only using an unbiased methodology and our articles are not intended to be financial advice. It does not constitute a recommendation to buy or sell any stock, and does not take account of your objectives, or your financial situation. We aim to bring you long-term focused analysis driven by fundamental data. Note that our analysis may not factor in the latest price-sensitive company announcements or qualitative material. Simply Wall St has no position in any stocks mentioned.
Have feedback on this article? Concerned about the content? Get in touch with us directly. Alternatively, email editorial-team@simplywallst.com